Analyze financial statements in Phocas
- Helen Gosper
- Denise McGettigan
- Former user (Deleted)
This documentation is for an older Financial Statements offering.
You might also be interested in the documentation our current Financial Statements product, which offers the ability to fully customize statements, add or edit categories and create multiple statements for different audiences - all within Phocas.
Contact your Phocas account manager or Support in your region for more information about accessing this functionality.
How the grid looks
- Instead of a standard Phocas grid you see a 'financial statement' view of data (the default mode is P&L), with the summary button automatically selected. This button will take you back to financial view from other dimensions.
- When you expand a category heading, the total appears in bold at the bottom of the category, in keeping with IAS 1 formatting. The order of the rows can't be changed or filtered.
- Depending on which mode you are in (except for trial balance), you can add 'financial' columns in the grid, or choose a 'period mode'-style view.
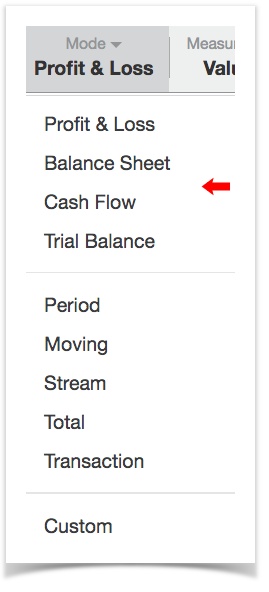
- The financial modes appear at the top of the modes menu, as shown below.
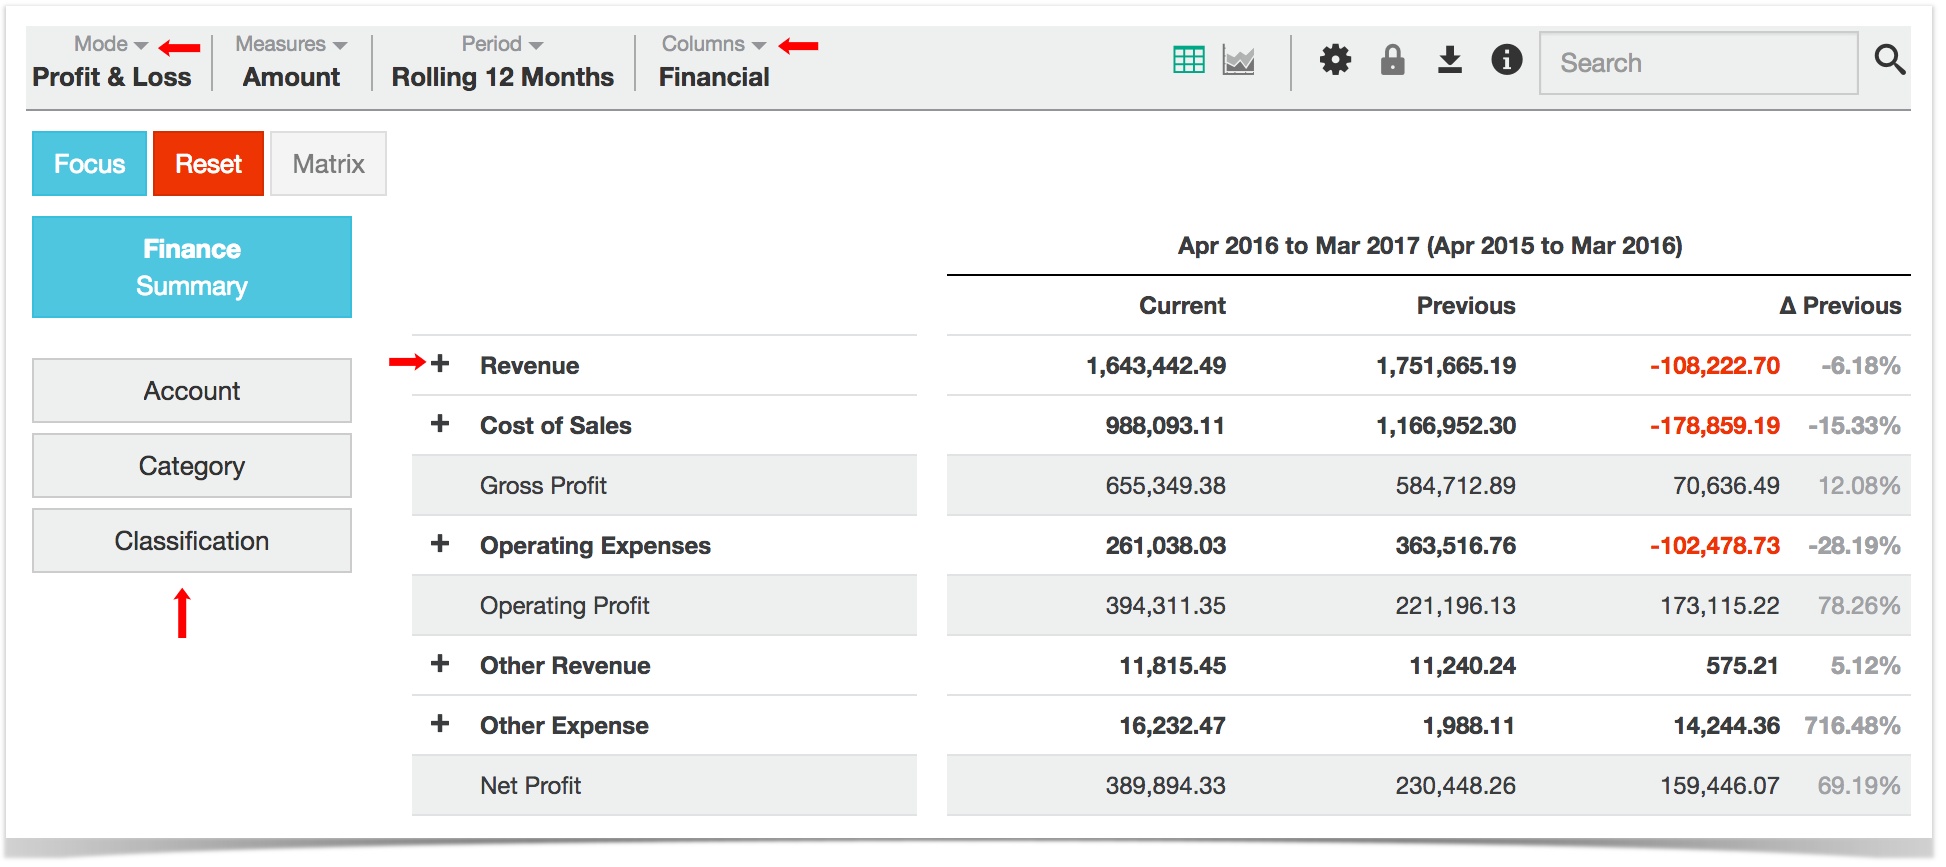
- The following three 'financial' dimensions always appear: Account, Category and Classification. Other dimensions, e.g., region, may appear below these. Selecting a dimension takes you out of financial statement view and into the standard Phocas grid (in period mode). To return to financial statement view, select the summary button.
- The 'show net zero' setting is turned off by default in a finance database. This means that you only see items where the measures have a value other than zero.
- The options to show 'average' and 'others' are not available in a finance database.
Financial columns
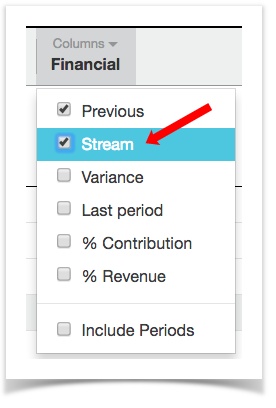
When you are in a financial statement mode, there is an additional menu called Columns, to the right of the period menu. In P&L mode, you can select from a number of 'financial' columns or choose a 'period mode'-style view. Select Columns > Financial to see the options. In Balance Sheet and Cash Flow there are fewer options and trial balance mode the financial columns menu does not appear.
- Previous. Displays the previous period.
- Stream. Displays a (budget) stream. If you have multiple streams, use the stream variance button to choose which is displayed.
- Variance. Adds variance column(s), showing actual and percentage variance of previous and/or stream against current.
- Last period. Adds a new set of P&L data for the most recent 'moment' in the current period.
- % contribution. Displays the percentage count for each item relative to the category to which it belongs, e.g., Wages 65% would indicate that wages represent 65% of all expenses.
- % revenue. Displays the percentage count for each item relative to the entire P&L statement. Wages 35% would indicate that wages expense is 35% of revenue. Note that this excludes the category 'Other revenue'.
In P&L mode the Columns menu contains a separate option to Include Periods. This displays a 'period mode'-style view of the selected financial statement, and the other options in the menu become unavailable.
Profit and loss
The grid typically displays the following expandable headings:
- revenue
- cost of sales
- operating expenses
- other revenue
- other expenses.
The following rows are also displayed: Gross, operating and net profit.
The default columns are 'Current', 'Previous' and two variance columns (actual variance and percentage variance). The variance columns are grouped together under one heading (which includes the triangle, or Delta, symbol for change).
Financial columns
These help build a view of your P&L, e.g., starting with current and previous P&L only, then adding budget column to the grid, or more comparison columns.
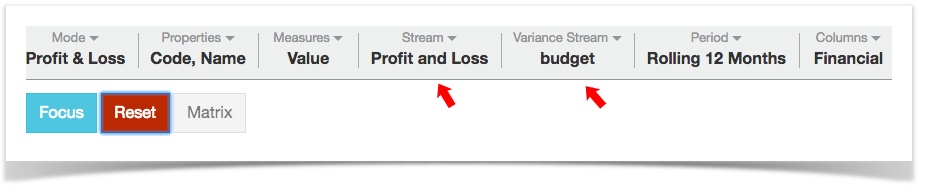
Stream and variance stream
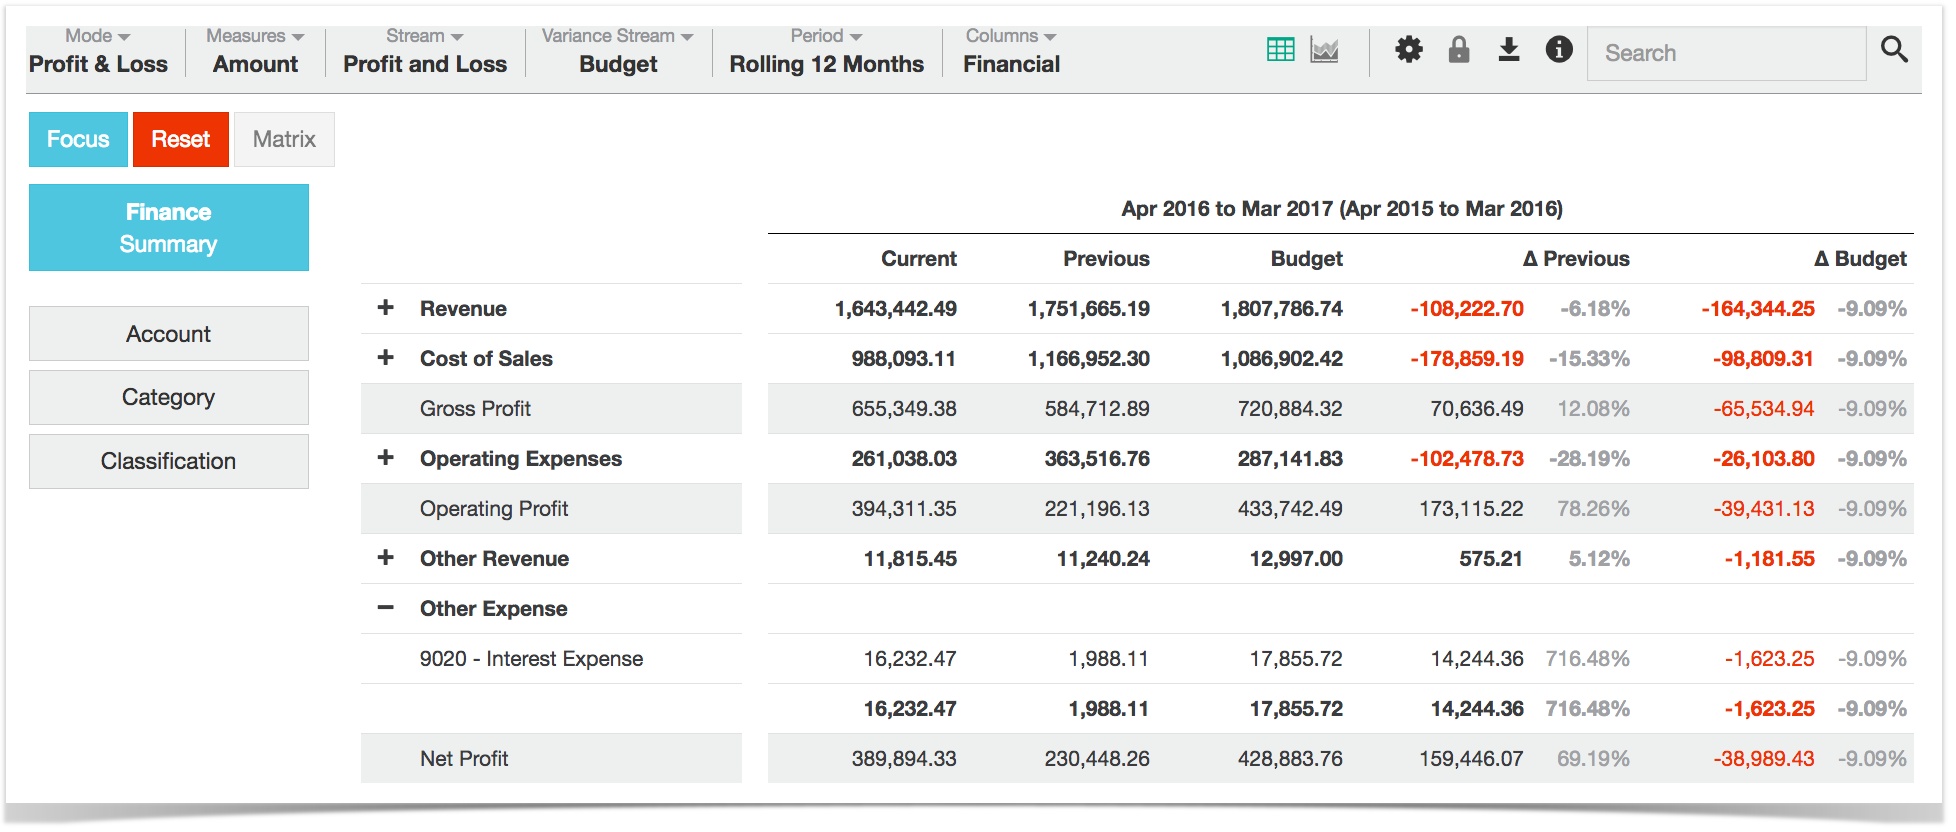
If you have another stream, such as budget, and if you have selected Columns > Stream, there will also be stream and variance stream columns, as shown in the image above.
P&L is the only financial mode in which you see the stream and variance stream button. In additional to the default P&L you may see a budget stream, provided the database contains that stream.
Include periods in your view
Select Columns > Include Periods to see a 'period mode'-style view of the selected financial statement. The other financial columns are unavailable while in this view.
Only one measure can be selected at a time, e.g. 'amount', 'value', etc.
Balance sheet
This mode displays a typical balance sheet layout, listing:
- Current assets
- Non-current assets
- Current liabilities
- Non-current liabilities
- Equity
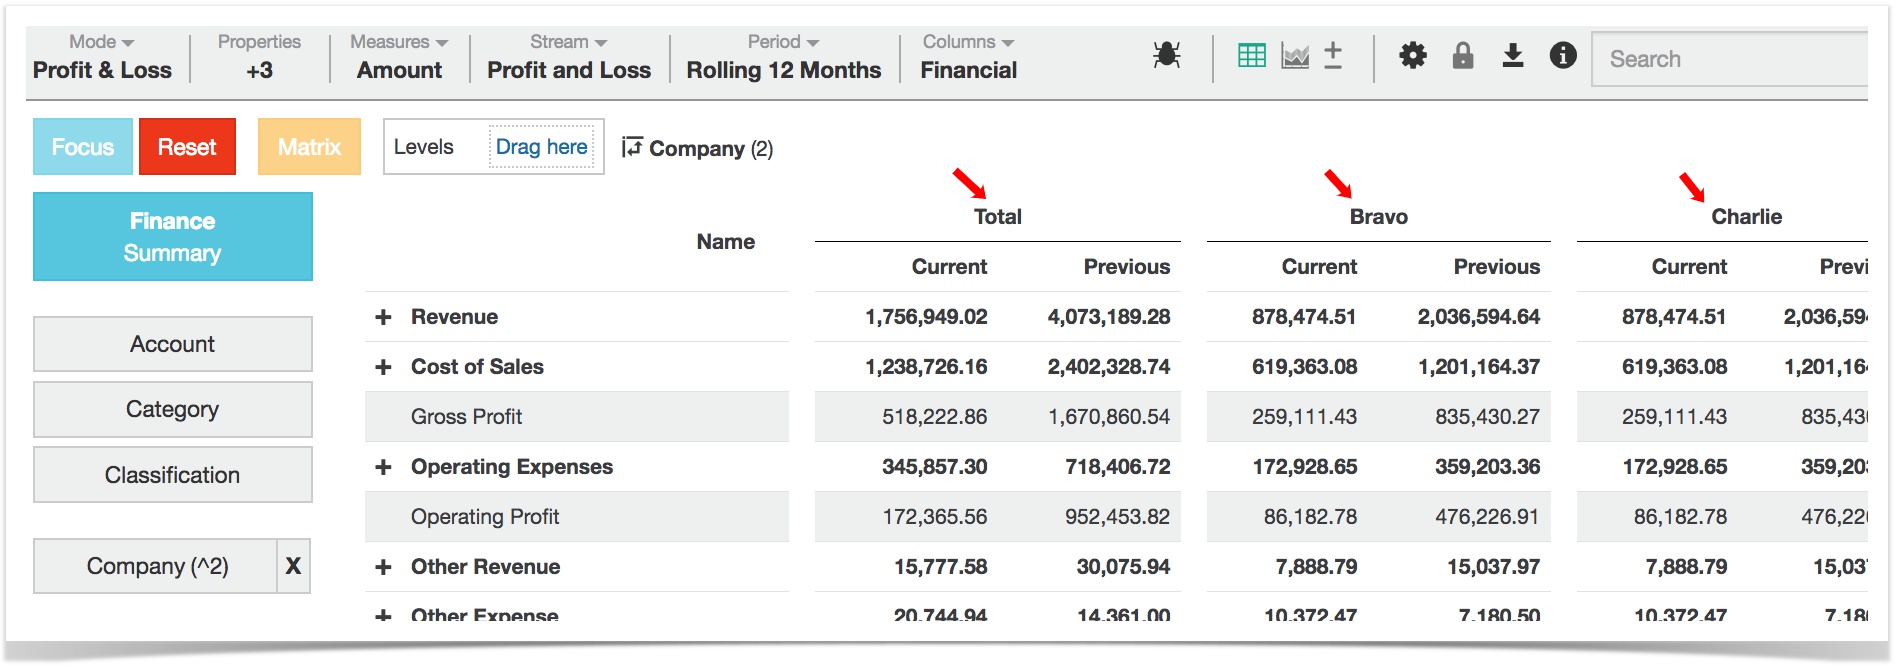
The following rows also display: Total Assets, Total Liabilities, Total Liabilities and Equity.
The available financial columns are 'previous' and 'variance'.
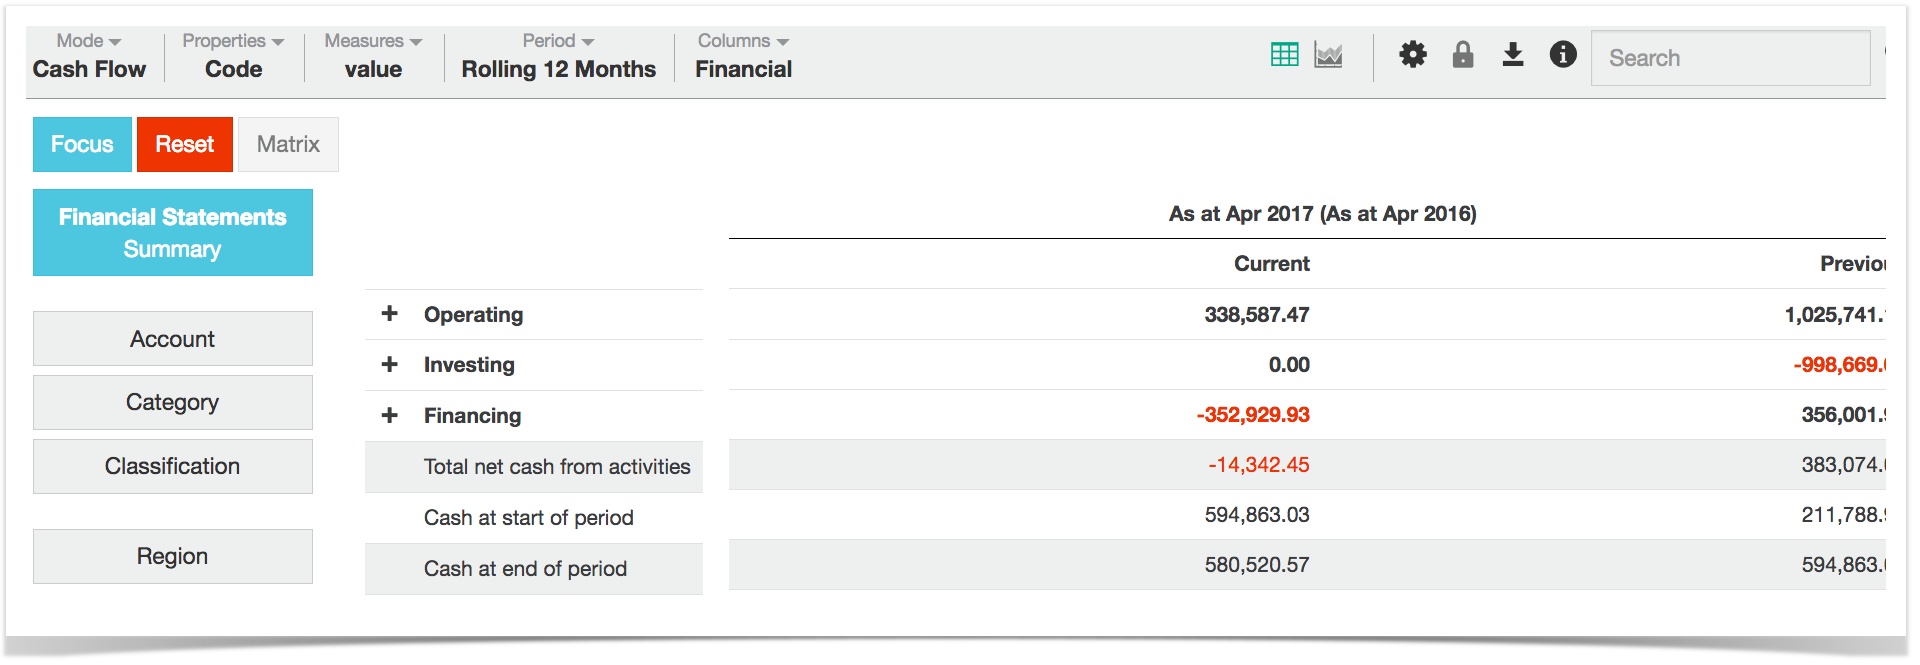
Cash flow
This mode displays a typical statement of cash flows, listing:
- Operating
- Investing
- Financing
The only available financial column is 'previous'.
The following rows also display: Total net cash from activities, Cash at start of period and Cash at end of period.
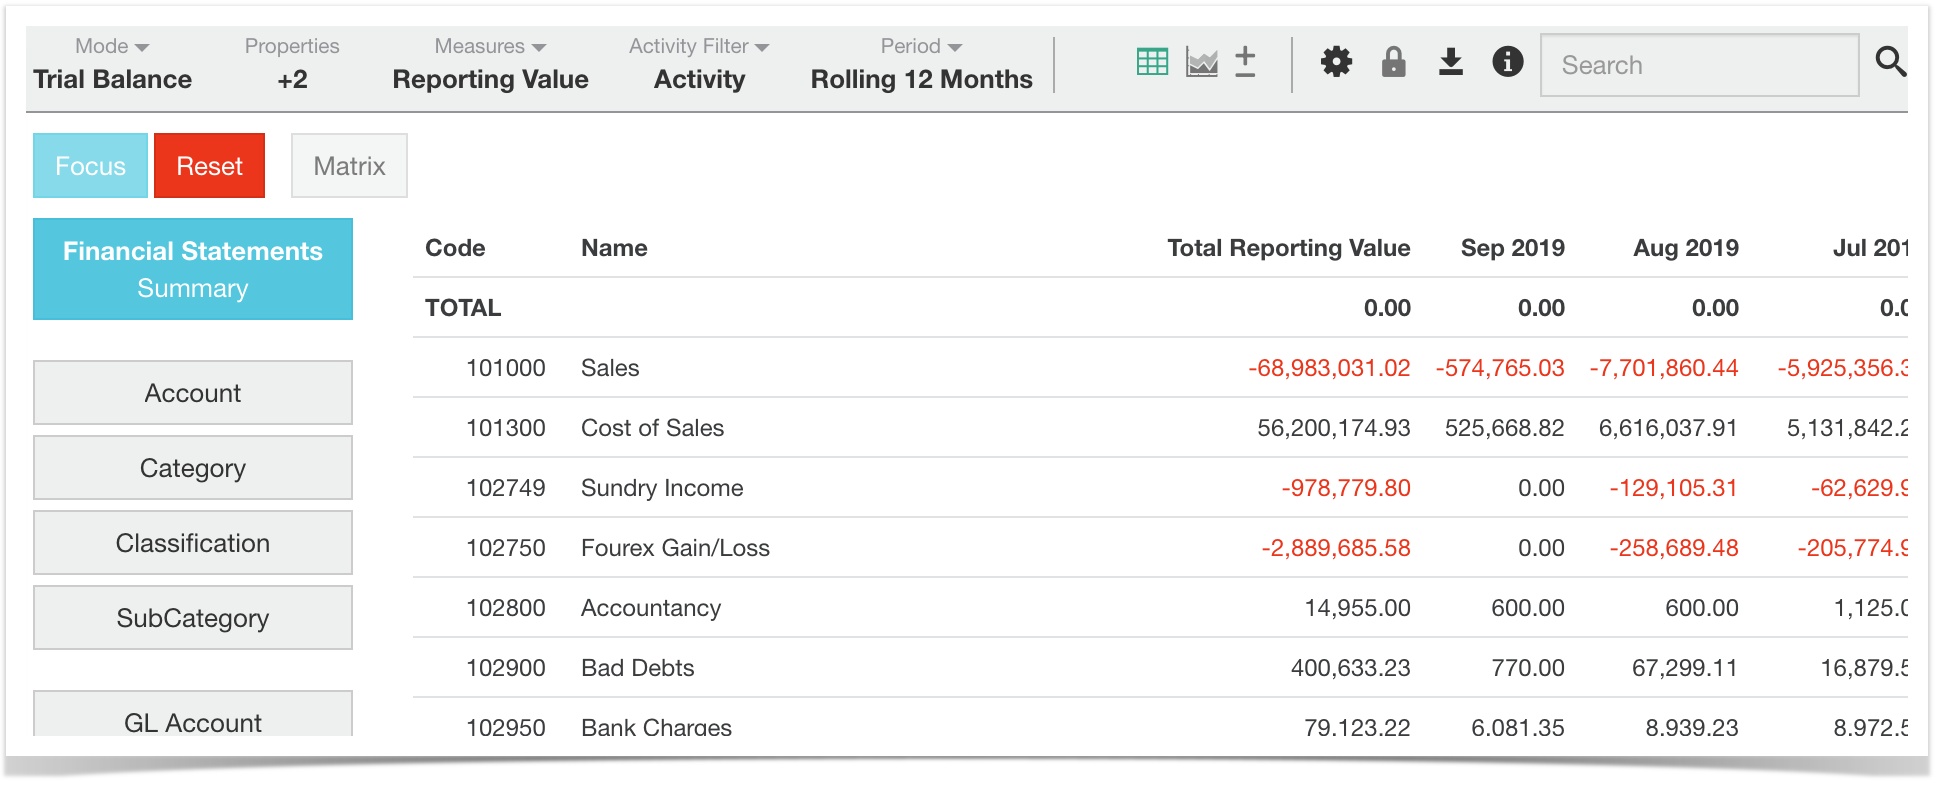
Trial balance
This mode displays the movement in account balances between certain dates and is useful in helping to locate errors. If all accounting entries have been recorded correctly in your source data, the total of each column should be zero (this is the total row at the top of the grid). if it isn't zero then that means there is an error. A trial balance is typically the first step towards the preparation of financial statements.
Note that in trial balance mode the financial columns menu doesn't appear.
How 'current period' affects Trial Balance comparisons
- To compare Trial Balance with P&L figures set the 'current period' as the financial period for which you want to compare results.
- To compare Trial Balance with Balance Sheet figures set the 'current period' to start at the date on which the company began trading and to end at the end of the financial period for which you want to compare results.
Customising/formatting
Removing 1000s
You may want to remove thousands, so that for example 4,000 becomes 4, and 57,300 becomes 57.3, and so on.
Select Measures > Formatting > Choose a measure (say, Value) > Custom and then manually type in this code:
- For millions: #,##0,,.00
- For thousands: #,##0,.00
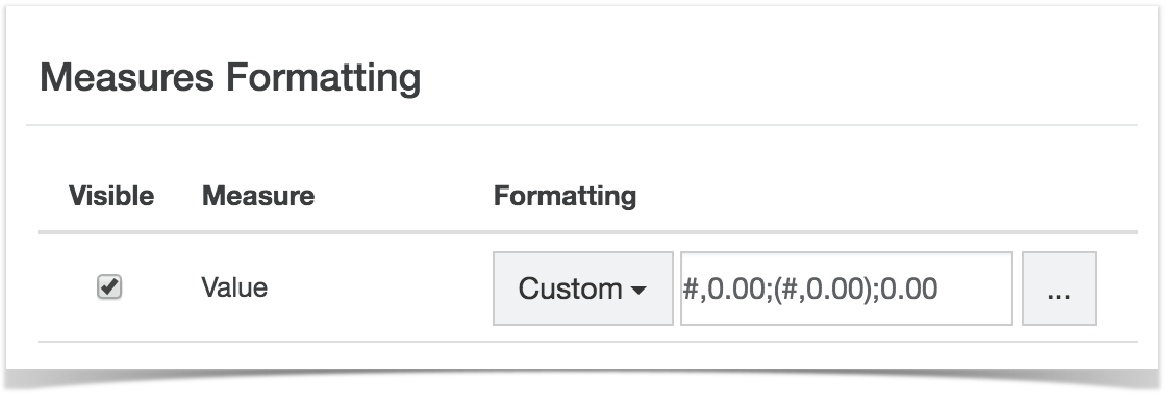
Display negative figures in parentheses
Negatives are shown with a minus sign by default. You can change this to display them in parentheses, although this is for advanced users.
Select Measures > Formatting > Choose a measure (say, Value) > Custom and manually type in this code
- #,0.00;(#,0.00);0.00 (also shown in screen shot below)
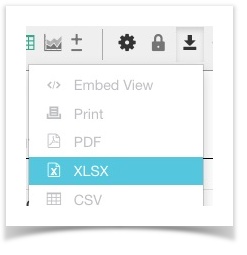
Export to Excel
To export a financial statement to a spreadsheet, choose a financial statement mode, e.g., P&L, and select Export > XLSX, as shown below. This produces an Excel spreadsheet containing the selected financial statement. To print more financial statements, select another mode and repeat the process.
The spreadsheet contains two tabs:
- The 'Data' tab contains the relevant financial statement. Formulas are carried across, e.g., in a Cash Flow statement, the value cells associated with the line 'Total net cash from activities' would contain the relevant 'sum' formula (i.e., the values for operating + investing + financing).
- The 'Query information' tab contains information about what you were looking at in Phocas at the time of exporting. It includes details such as export date, date the data was last updated user, database, measure, mode, filter (e.g, 'ales only'), format, stream, period and columns.
To print a financial statement, export to Excel and print from there.
Add your own level to your financial statements view
You can tailor your view of financial statements by adding another level below the standard IAS 1 categories that appear in Phocas.
To do this, drag a dimension into the 'Levels' box, above the grid. When you expand this new level, it breaks the top level down into whatever level or sub category you have added. Expanding further takes you to account level. The level is retained when you export to Excel.
The additional level is available in all financial statement modes except for Trial Balance.
Example - view financial statements by Sub Category
In P&L mode, drag the dimension 'Sub Category' into the box next to Levels. Note that you can't drag any of the top three dimensions (i.e., the standard categories of account, category and classification).
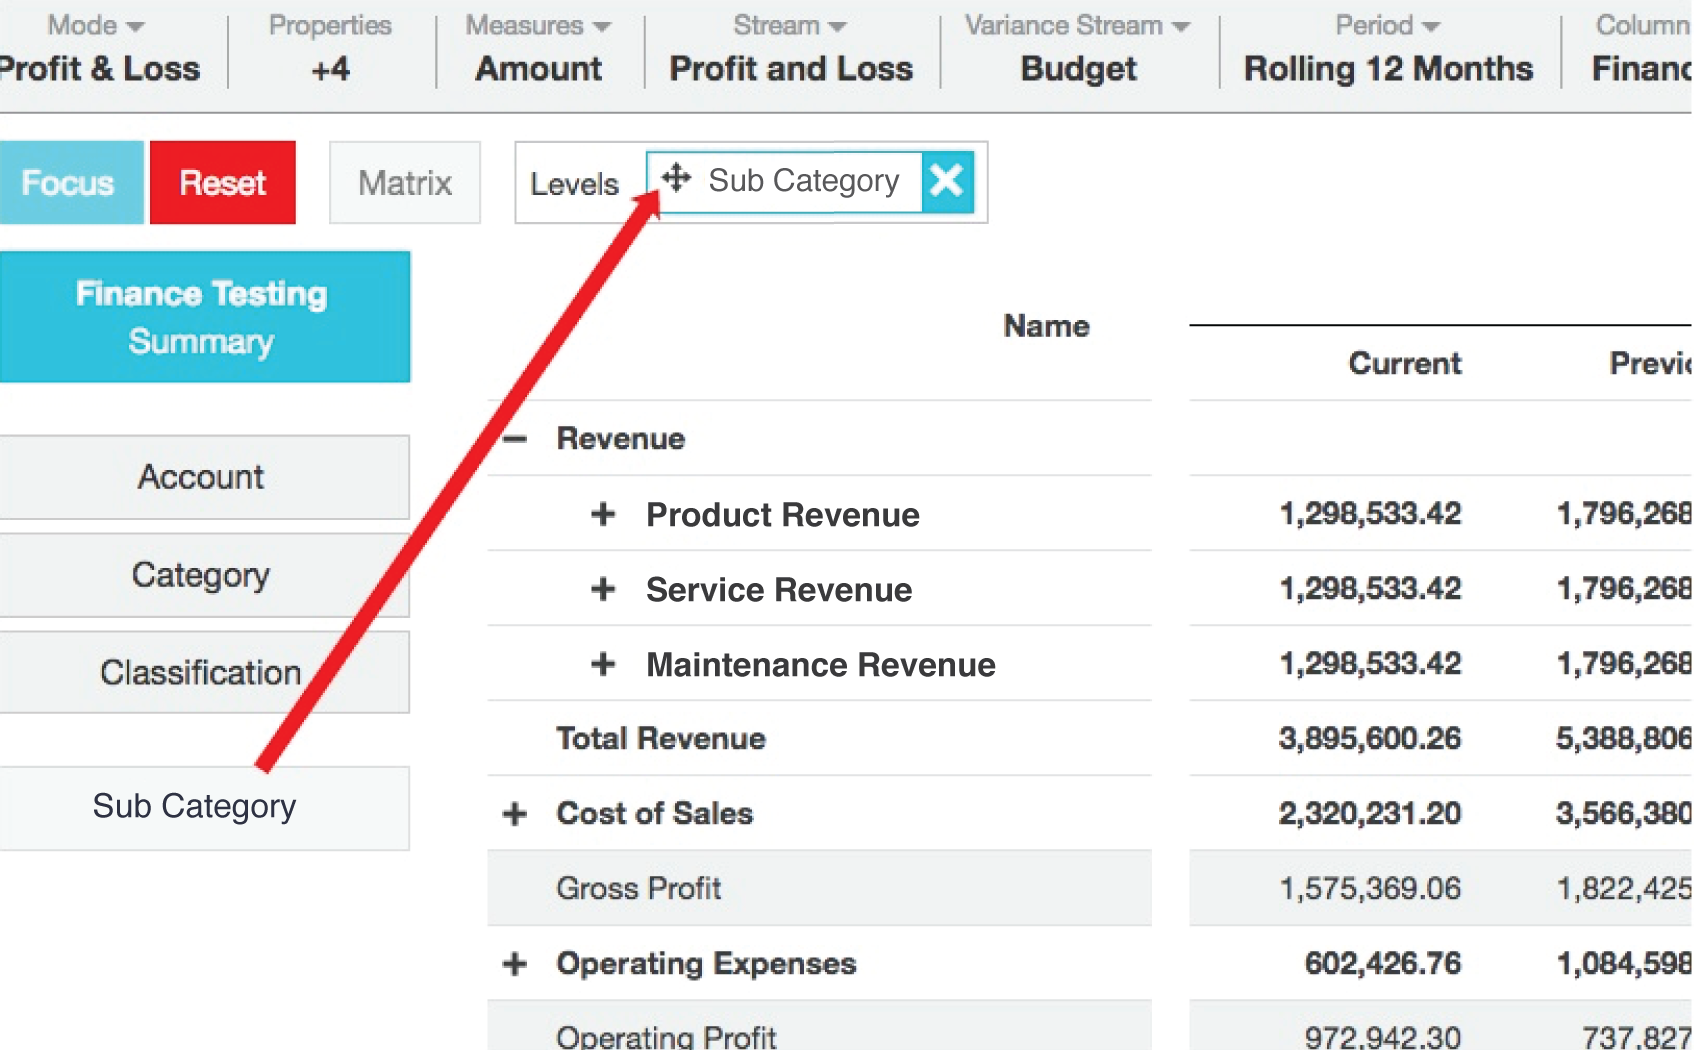
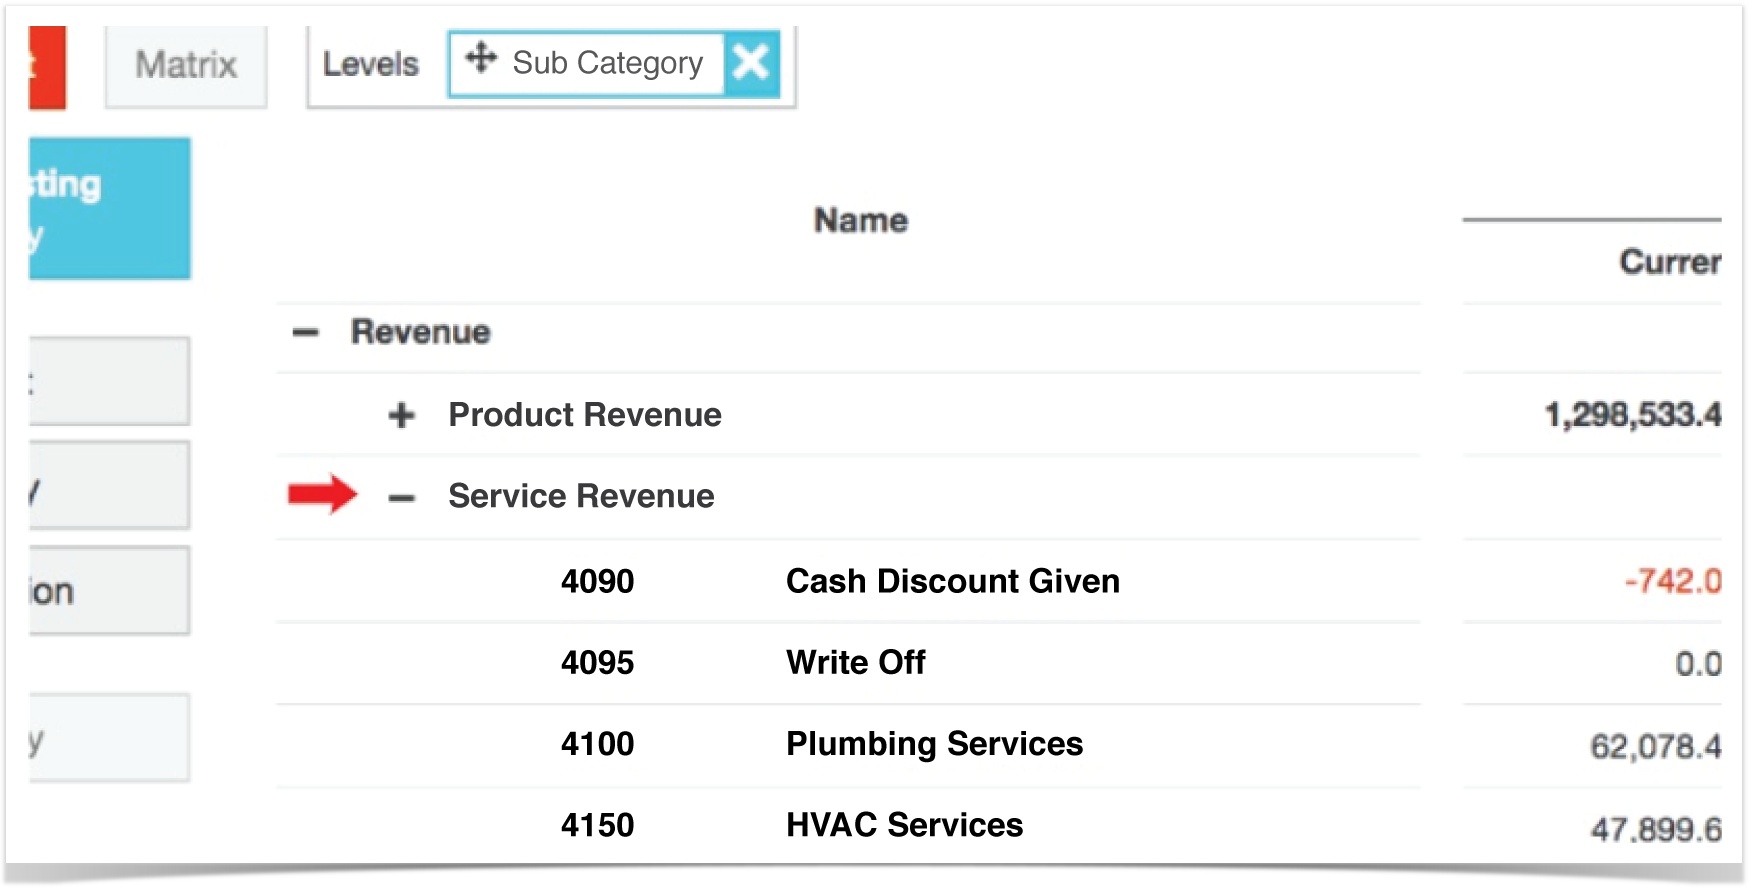
In the image below, expanding the top level (revenue) reveals three sub-categories, each reflecting the different types of revenue. Expanding one of these takes you down to account level.
Levels in financial statements view and standard Phocas views
Note that in financial statements view the Levels option automatically appears (apart from in trial balance mode) whereas in standard Phocas views, you need to activate this option via the Expand/collapse icon (next to the chart icon).
Using matrix mode with financial statements
You can compare the performance of two or more regions, groups, companies, etc by matrixing in the Phocas grid and then switching back to Financial Statements view.
Do this by selecting any dimension below the top three (i.e., the standard categories of account, category and classification). Selecting a dimension takes you out of financial statement view and into the standard grid (in period mode). Without focusing click Matrix as you would in a standard database (see Compare data with Matrix mode). Then select the summary button (which takes you back to financial statement view) to see the results of your matrix side by side in P&L view, along with a 'total' section showing the sum of the matrixed items. You can also switch to balance sheet or cash flow to view the results.
How to use financial statement modes
Below are some examples of how you can use financial statement modes to drill down into your accounts using Phocas.
Drill down into a divisional P&L
Select the 'division' dimension (or branch, or region, etc.). Choose a division and focus.
Then go back to the summary dimension at the top to view the P&L. You'll now see the P&L just for that division. You can choose to view the other financial statements for that division too by changing the mode.
Compare P&L for two regions, groups, etc side by side
You can compare the performance of two or more regions, groups, companies, etc by matrixing in the Phocas grid and then switching back to P&L mode.
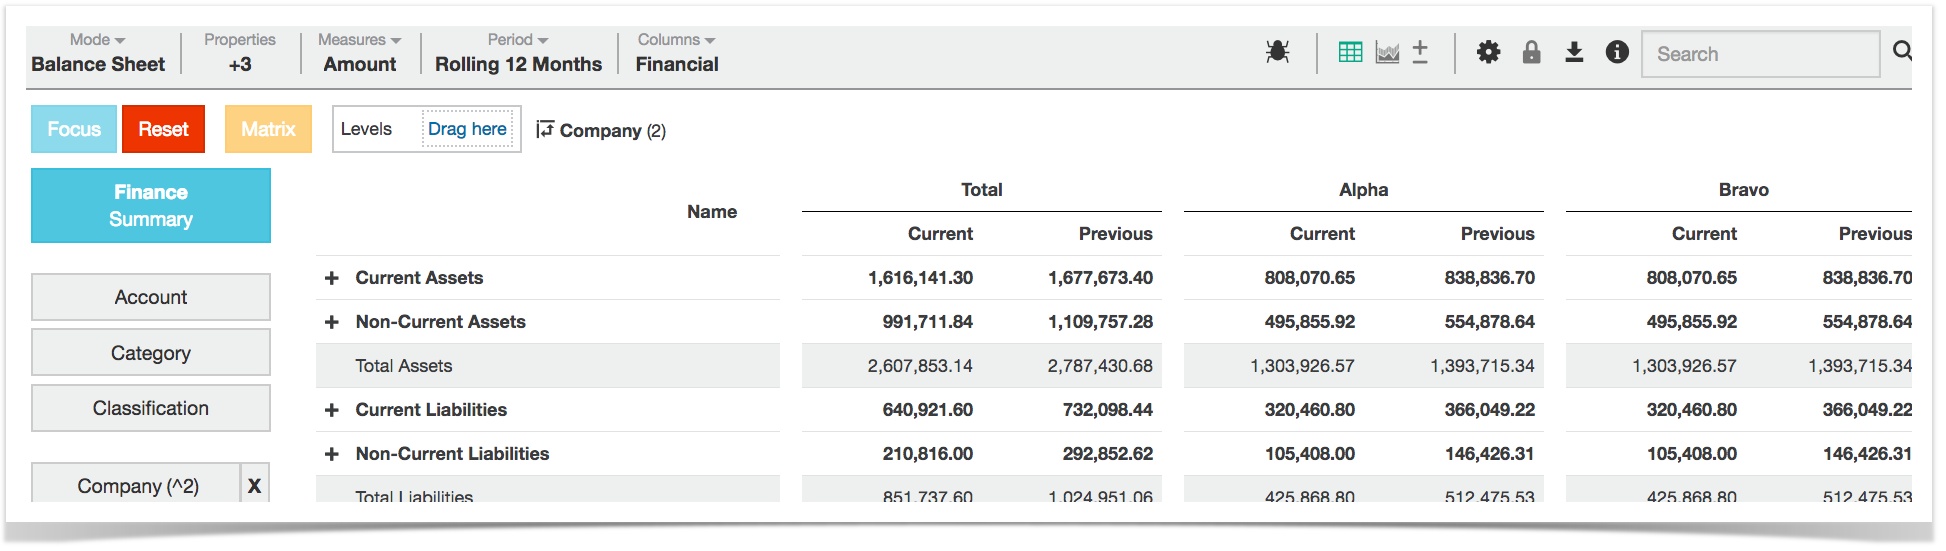
Example. In the example below, the user wants to compare 'Bravo' and 'Charlie'. To achieve this:
- Select 'Company' dimension (you could do this with region, territory, country, area, etc)
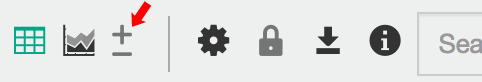
- Select Charlie and Bravo. Without focusing click Matrix (image at top). More about /wiki/spaces/DOC/pages/1082381.
- Go back to Summary (which takes you back to financial mode). See the P&L statements for Charlie and Bravo side by side (image at bottom).
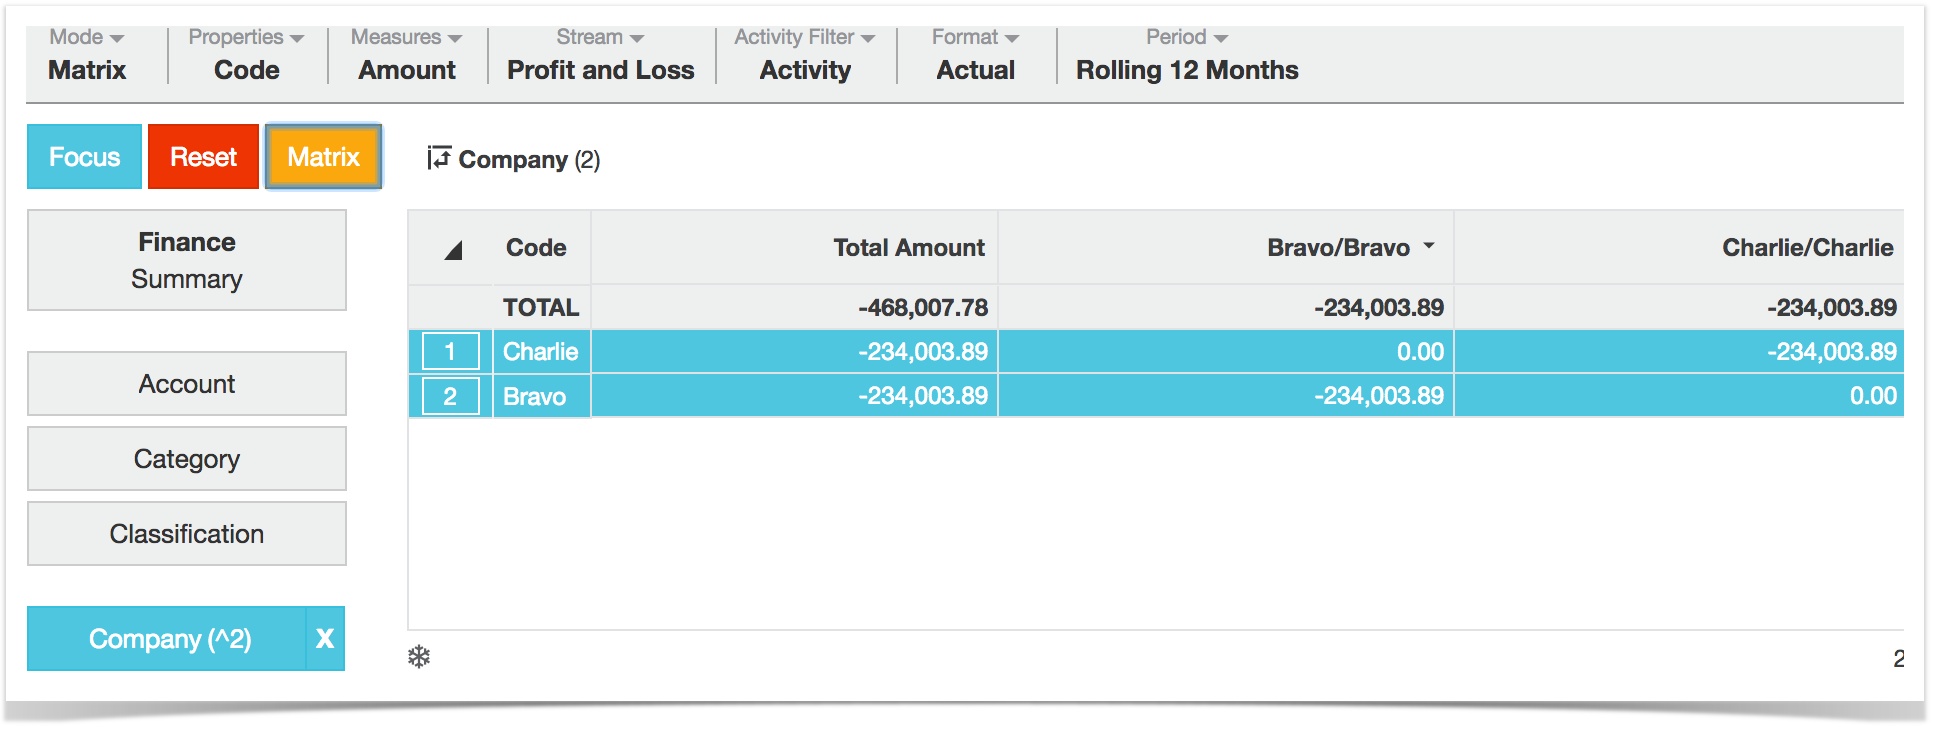
The P&L results for Charlie and Bravo are displayed side by side, along with a 'Total' section to the left, showing the sum of the matrix.
Analyse results beyond the financial year
This example shows how to conduct a calendar year P&L analysis for the 'last 12 months'.
- Select Period > Custom
- Set the current period to start at Jan 2016 and end at Dec 2016. The previous will automatically set to Jan and Dec 2015. Save.
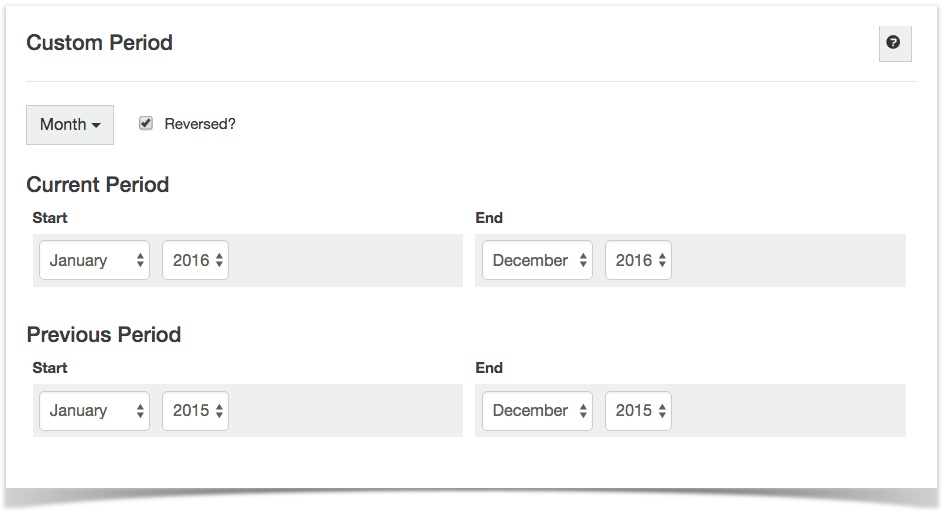
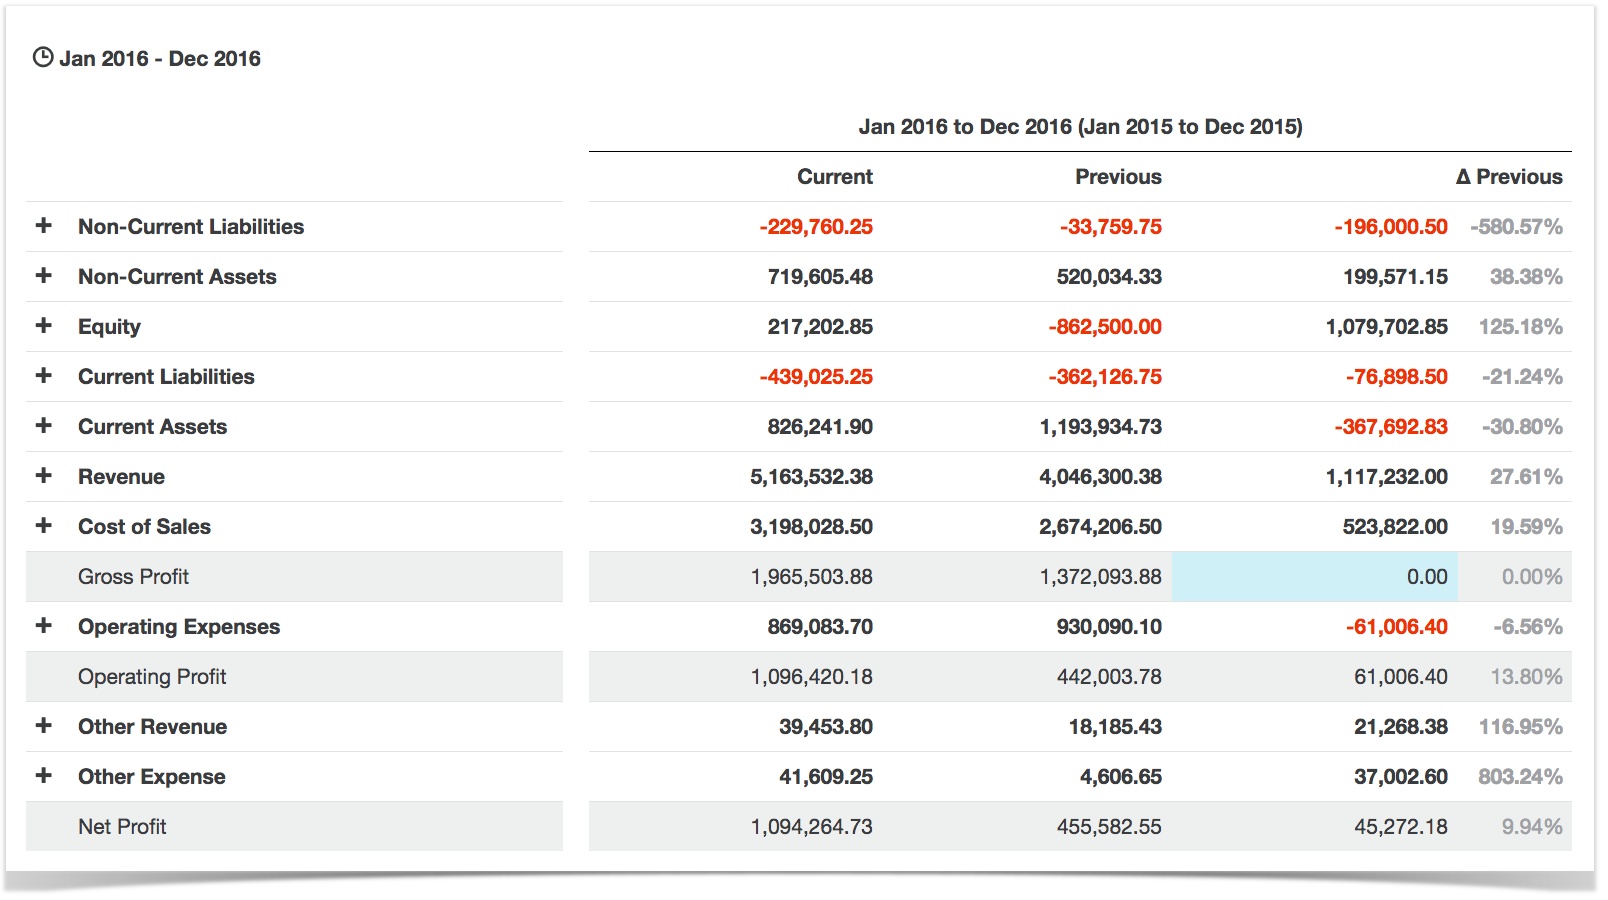
The P&L statement now displays the change between calendar years 2016 and 2015.
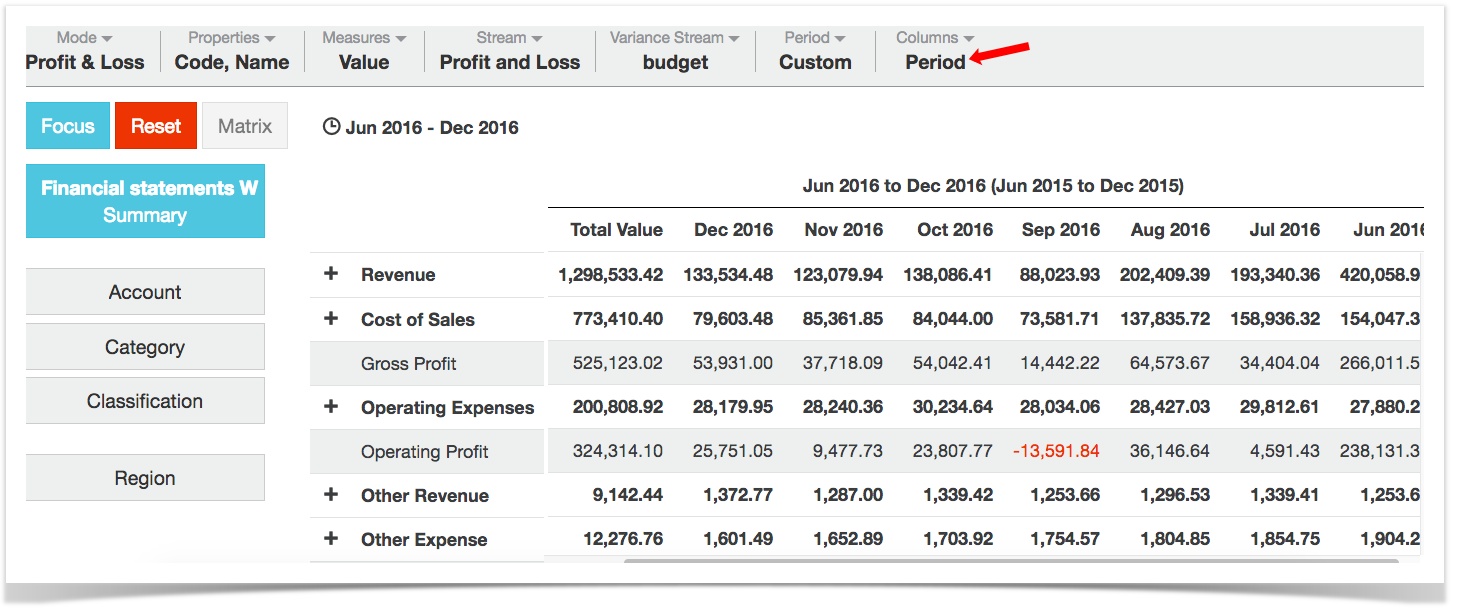
View P&L for the last three calendar years
Select Period > Custom
Choose 'Year'. Set the current period to start at 2015 and end at 2017. Save.
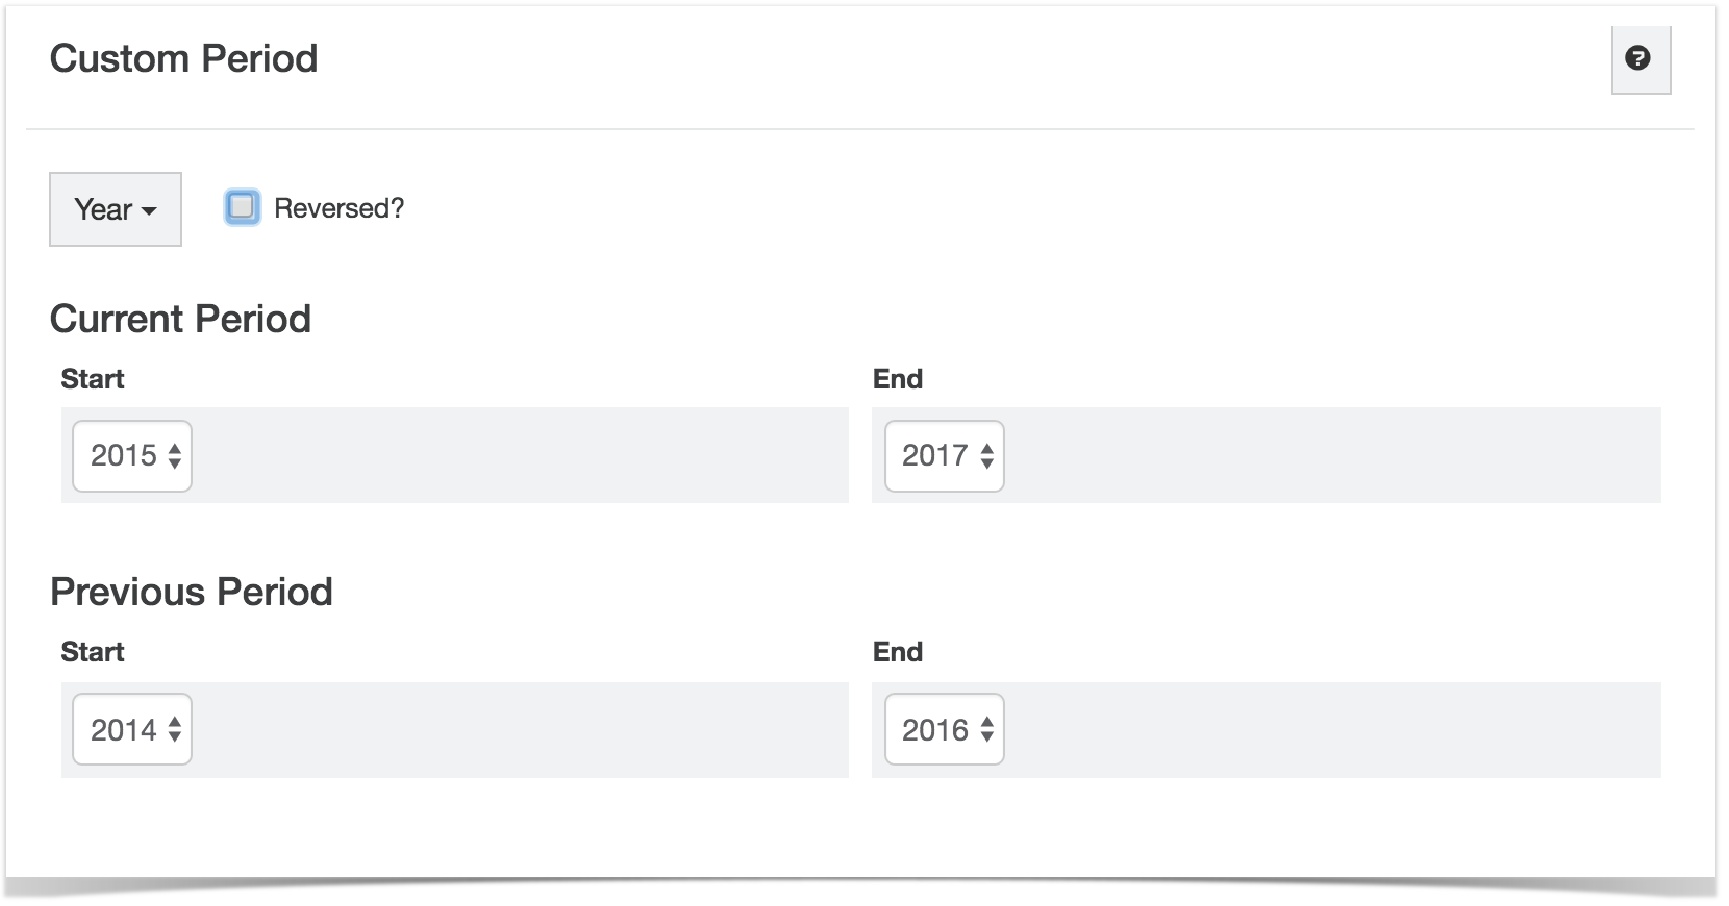
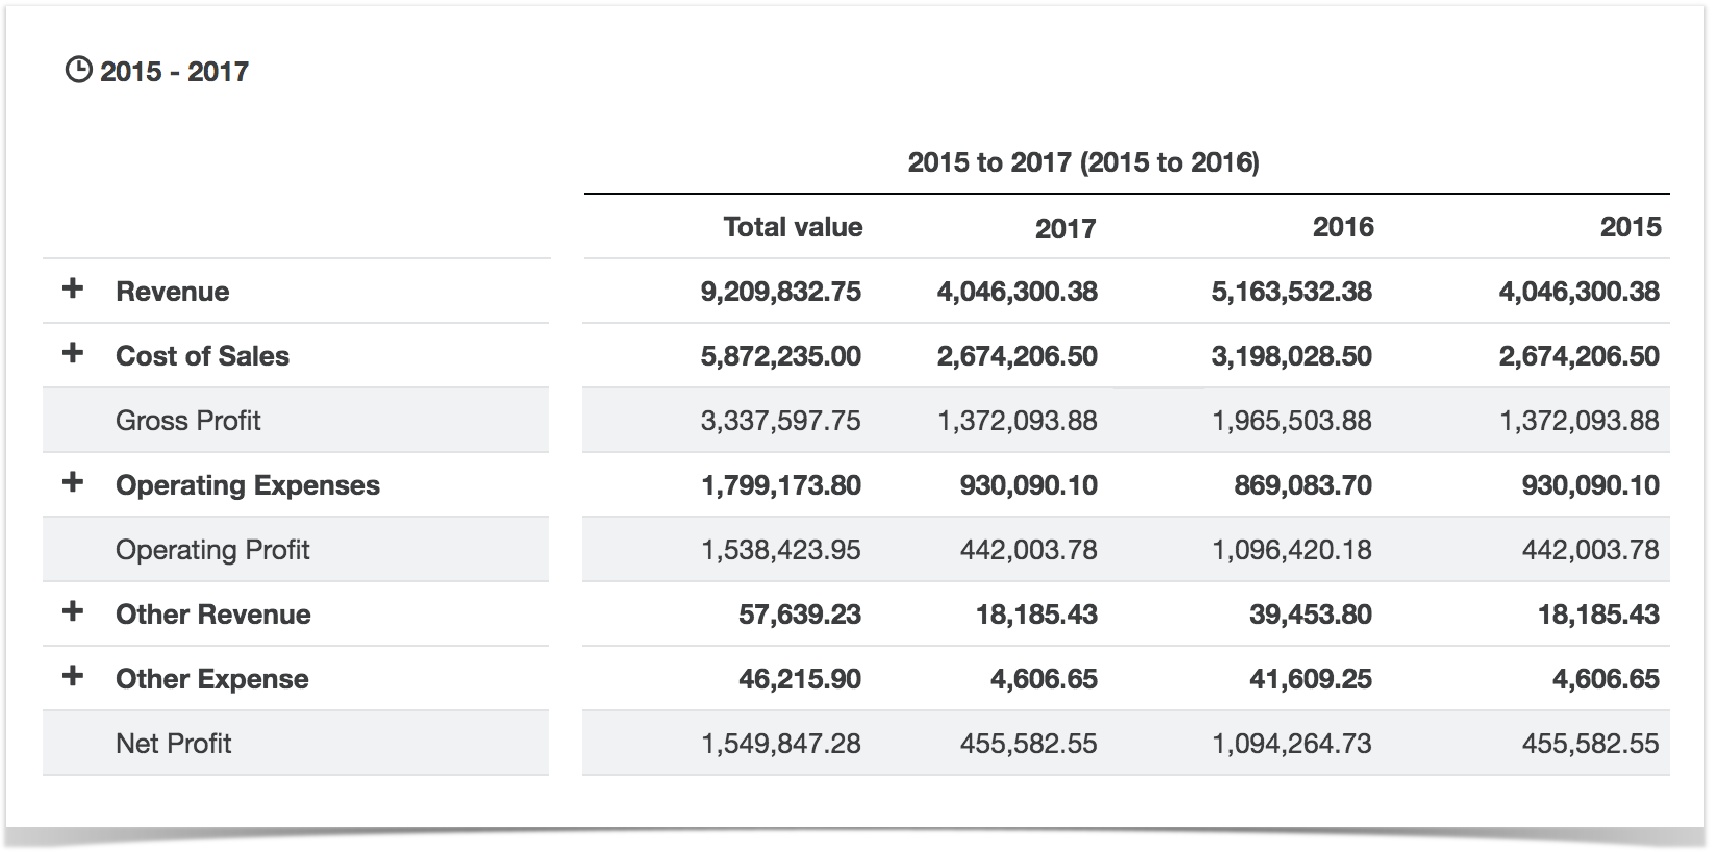
Then choose 'period' from the columns button. You'll get something like this:
See where the money went, viewing historical cash flow statements
To see the split between investing, financing and operating activities, choose Cash Flow mode. To look at the cash at the start of the period, and the cash at the end of the period, use Period > Custom to set a period for comparison.
See the % contribution of a line e.g., 'What percentage of my operating expenses are in wages?'
- Select Mode > Profit & Loss (this is the default, so it may already be chosen)
- You might like to expand the ‘operating expenses’ section here by clicking the ‘plus’
- Select Columns > ‘% contribution. Additional columns will appear.
- Start analyzing. Look in the ‘current’ column. If ‘wages’ is one of your expense accounts, you’ll now see how much was spent on wages, and the next column to the right will show you what percentage wages is of your total operating expenses. (note: A % contribution column will also appear to the right of your ‘previous’ and ‘stream’ columns that are visible)
Tip: you can also choose the ‘% revenue’ which works the same way, but shows you a different percentage.