Versions Compared
compared with
Key
- This line was added.
- This line was removed.
- Formatting was changed.
Insert excerpt
 Image Removed
 Image Added
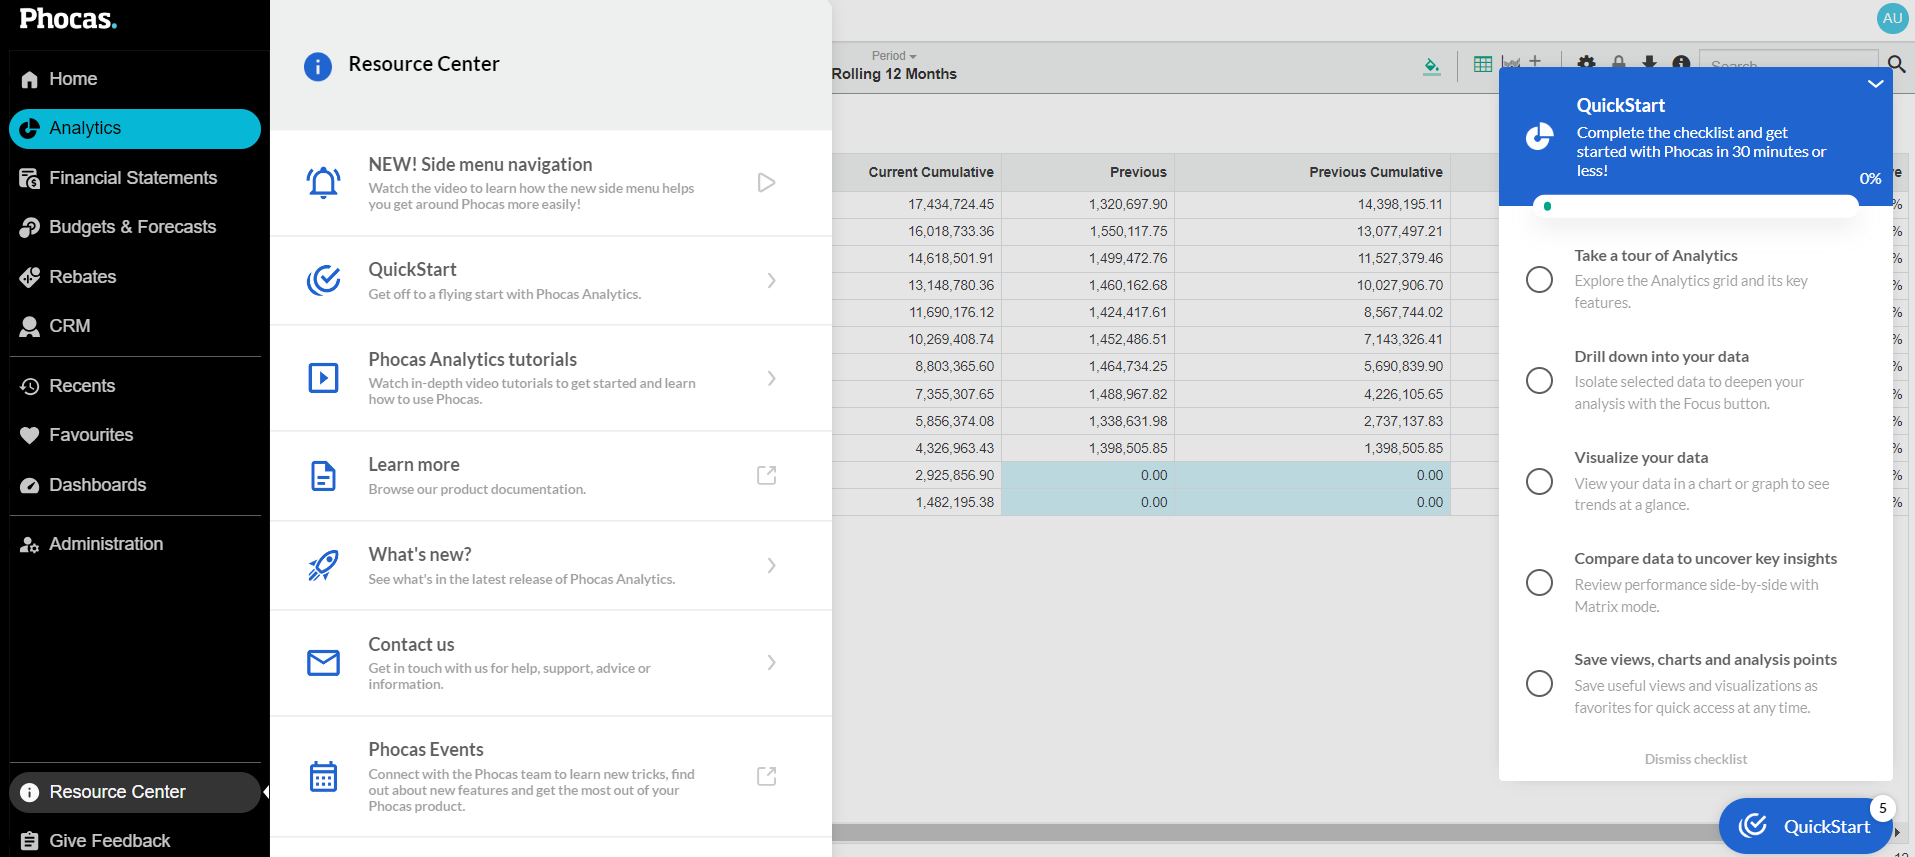
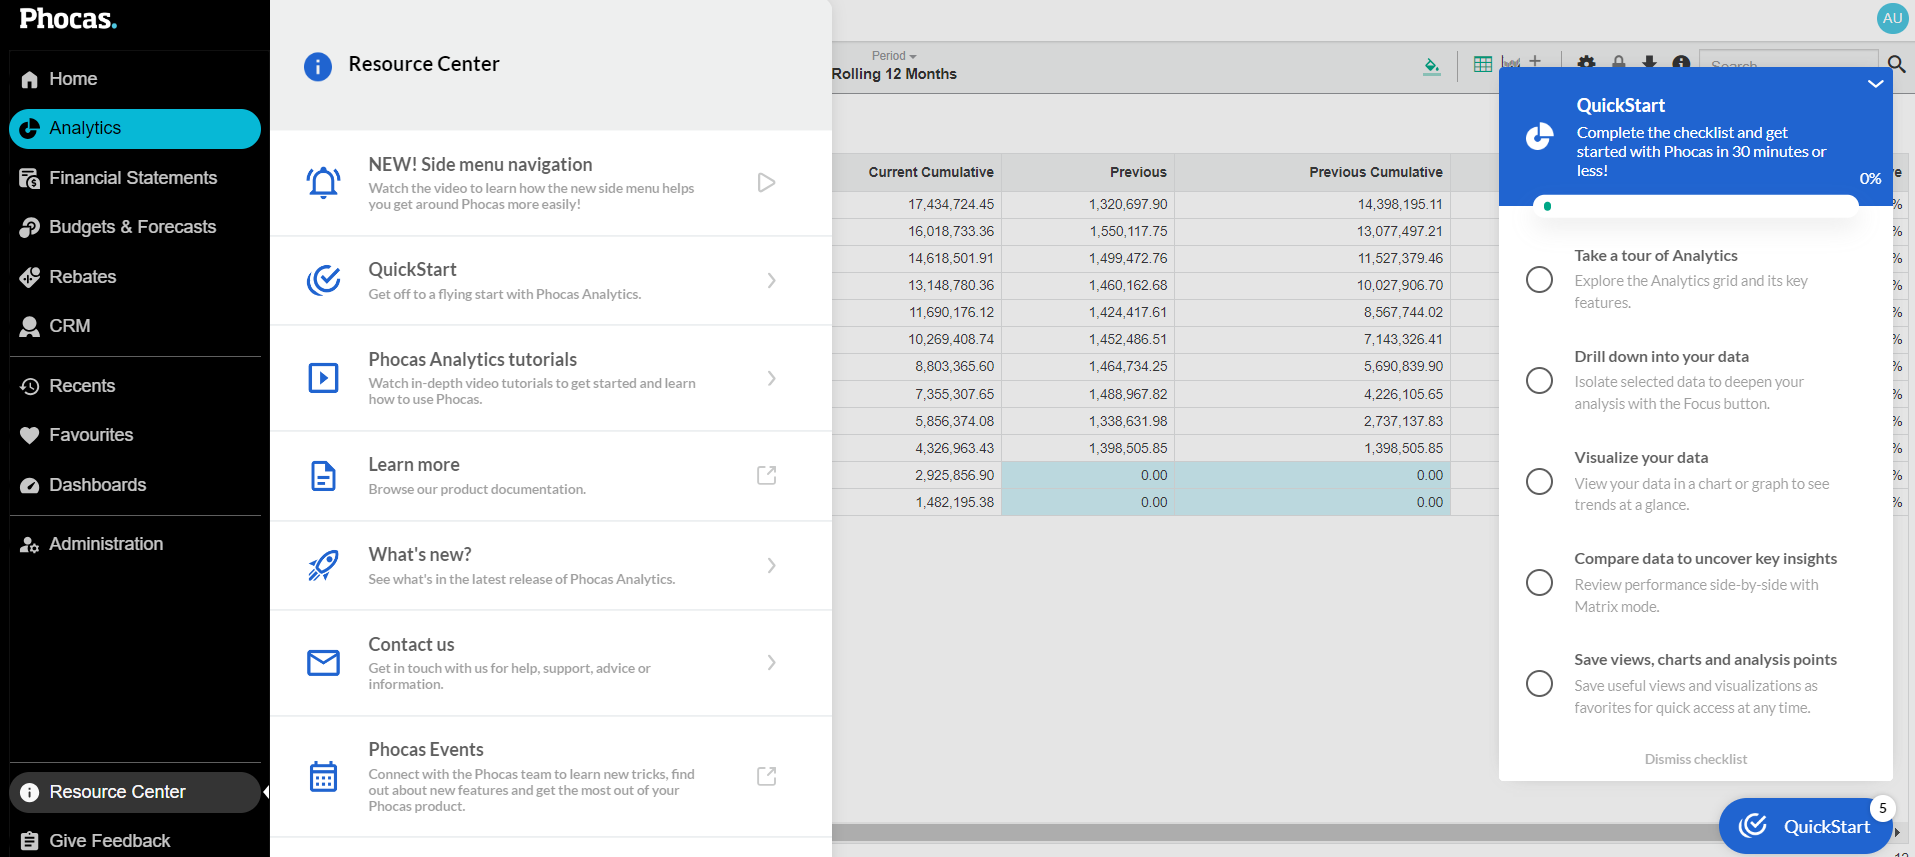
For detailed steps, click on the links below.
Take a tour of Analytics - Explore the Analytics grid and its key features.
Drill down into your data - Isolate selected data to deepen your analysis with the Focus feature.
Compare data to uncover key insights - Review the performance of regions, products, customers, and more side-by-side with Matrix mode.
Visualize your data - View your data in a chart or graph to see trends at a glance.
Save views, charts and analysis points - Save useful views and visualizations as favorites for quick access at any time.
| Panel | ||
|---|---|---|
| ||
Prefer videos? Watch the Phocas QuickStart: Analytics videos in the Academy. |