You can set color-coded alerts to automatically appear on your homepage or dashboard when performance against a target reaches a certain point. The alert appears if a number, such as a sales value, falls within a defined range. You can also subscribe to an alert to receive an email when it reaches a particular status. Typically, alerts are dynamic and will change each time you view them. The use of offset dates ensures that alerts update.
Create an alert
An alert is really just a Summary chart that is saved as a favorite, so if you’ve already created one, you can start from there. Alternatively, you can create a brand new alert during your analysis .
Create an alert fromand a Summary chart
favoriteYou create a Summary chart as usual and save it as a favorite. Whenever the values fall into the 'red' range, the favorite displays automatically as an alert on the homepage.
| Info |
|---|
You cannot save an emoji Summary chart as an alert, only as a favorite. |
Example - Create an alert for Lost Customerswill be created for you.
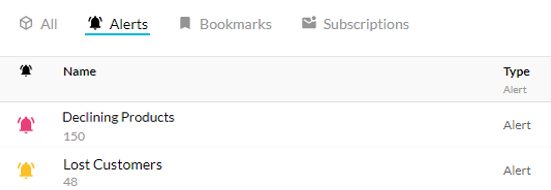
Either way, the alert item displays on the All and Alerts tabs on your Phocas homepage.
Create an alert from a Summary chart favorite
Suppose you carried out an advanced search and identified 251'thelost' customers, who have purchased something in the last year but nothing in the last three months.
Turn the search results into a summary chart and Create the Summary chart and configure the color ranges:
Click the Chart button in the top right toolbar above the grid.
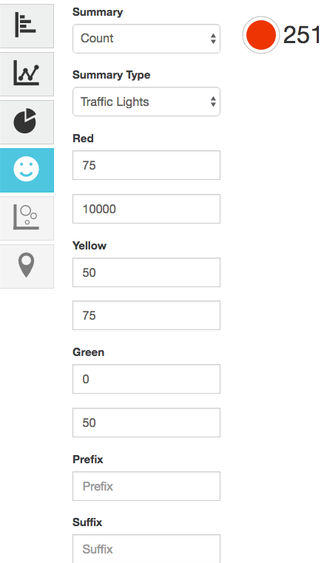
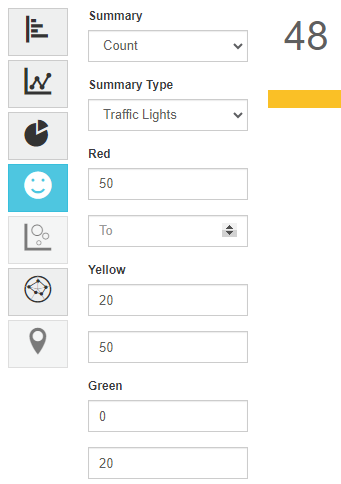
Click the KPI chart category button on the left of the chart and select the Summary option.
Select Summary > Count and .
Select Summary Type > Traffic Lights. Note that you cannot save an emoji Summary chart as an alert, only as a favorite.
Enter the From and To value range into the color boxes to set the conditional formatting. For example, so that up to 50 20 lost customers is acceptable (green), up to 75 50 lost customers is a problem (yellow), and anything more than 75 50 is bad (red).
Save the chart as a favorite:
Click the blue arrow next to the database name and select Save Favorite.
Enter a name for the favorite (Lost Customers).
Click Save. When the number of lost customers (251) falls within the 'red' range, this favorite displays on the homepage as an alert.
Go to your homepage to view the new alert.
Create a new alert
Select a database and carry out your data analysis (you can be in the grid or in chart view)Suppose you carried out an advanced search and identified theproducts you’ve sold in some quantity in the last year but nothing in the last two months. The results are displayed in the grid.
Click the blue arrow next to the database name and select Save Favorite Create alert.
Configure the alert to determine the ranges for the red, yellow and green color display. You will see a preview of what the alert will look like as you enter the ranges.
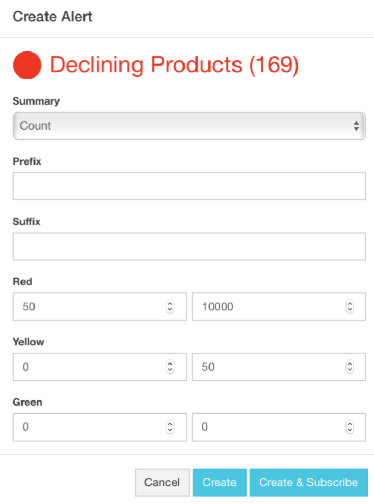
Enter a name for the alert (Declining Products).
Enter the From and To value range into the color boxes to set the conditional formatting. For example, up to 20 lost customers is acceptable (green), up to 50 lost customers is a problem (yellow), and anything more than 50 is bad (red).
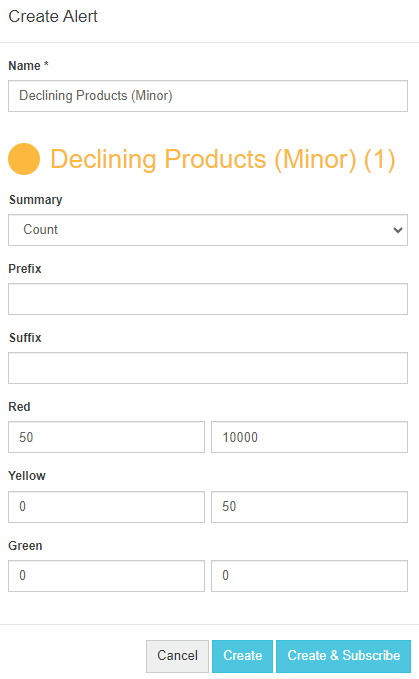
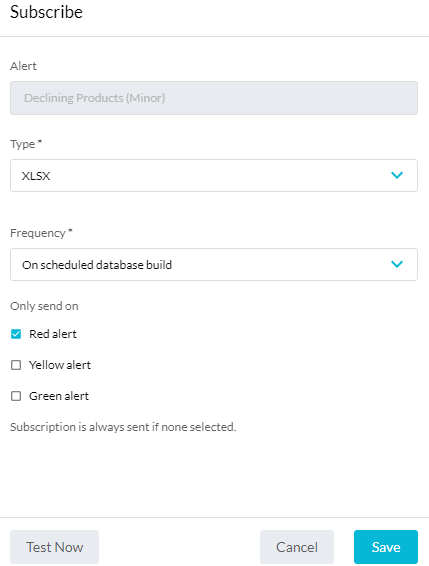
Select one of these options:
Click Create & Subscribe to subscribe to have an alert emailed when the alert and receive an email each time it reaches a particular status.
Click Create. The alert opens as a summary chart
Go to your homepage to view the new alert.
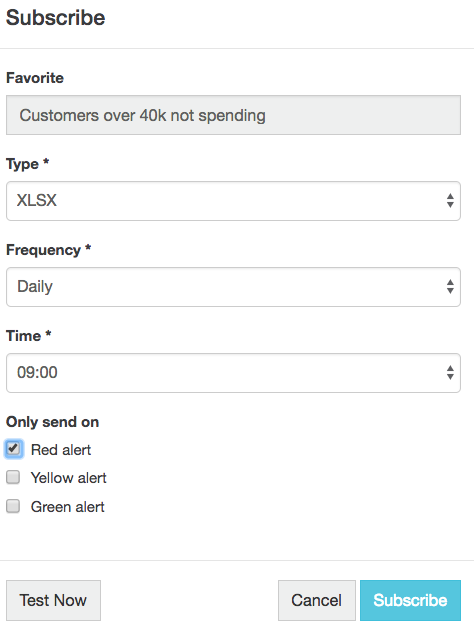
Subscribe to an alert
You can have an alert automatically delivered to your email inbox in a format of your choice. As an alert is a type of favorite, you subscribe to an alert in the same way you subscribe to a favorite. In The difference is in the Subscribe window, where you can select which status should trigger the email. Select the have the option to select the status that triggers the email: Red alert, Yellow alert, or Green alert status checkbox(es) as required. These statuses relate to the color of the icon that appears next to an alert on the homepage. If you do not select a status, the alert will be sent to your inbox at your nominated time, regardless of status.