Versions Compared
| Version | Old Version 3 | New Version Current |
|---|---|---|
| Changes made by | ||
| Saved on |
Key
- This line was added.
- This line was removed.
- Formatting was changed.
When you create a forecast, the forecast workbook opens
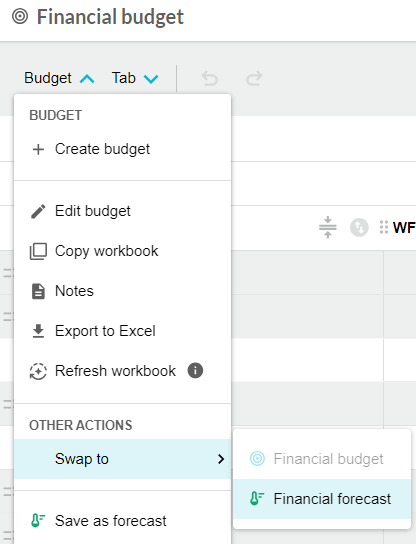
The Image Added
A forecast is always based on a budget. The budget workbook is converted into a forecast workbook. You can quickly differentiate a forecast from a budget workbook by the green Forecast button in the top left corner and the green Forecast flag pole in the grid.
To quickly switch between a budget and its forecasts (and vice versa), click the Budget menu in the top left corner, then click Swap to and select the workbook.
The Main tab of the forecast workbook has all the same elements as a budget workbook, along with some additional elements, the extras. The most notable being additions are the three total columns and the flag pole.
[need to change screenshot to match]
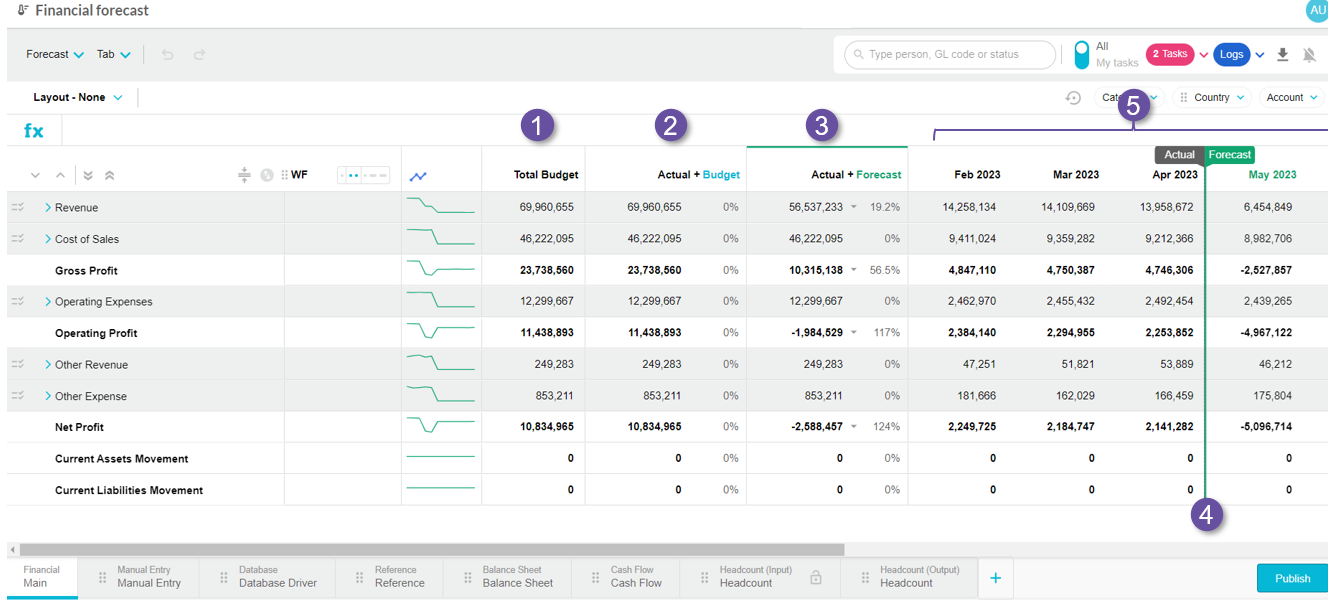
Actual + Forecast column - When you create a forecast workbook, this column is selected by default. It, which also act as buttons you can use to switch between different views of data. These and the other key elements of a forecast are identified by the numbers in the image below.
 Image Added
Main tab of a forecast
Total Budget column - Click this column to display your budget values for the entire period in the grid. The cells are not editable in this view, as the information is for reference purposes only. In this view there is no flagpole but a dotted vertical line displays at the end of the last fully completed month (period).
Actual + Budget column - Click this column to view the actual and budget values in the grid according to the period that was selected in the forecast setup, for example 1+11, 3+9 and so on. The actual values display to the left of the flagpole and the budget values display to the right. The cells are not editable in this view, as the information is for reference purposes only. This view is useful when you start reforecasting, as you can use the flagpole to see what your original budget was.
Actual + Forecast column - This column is selected by default and it displays the actual and forecast values in the grid, according to the
period that was selected in the forecast setup
. The default position of the flagpole identifies
the current period. The actual values display to the left of the flagpole and the forecast values displays to the right of the flagpole. You can drag the flagpole back to the left to see what your forecast was (budget values). The default forecast values are the same as those in the Actual + Budget column but the cells are editable, so
this is where you do your reforecasting.
Flag pole -
This tool allows you to switch between the different data. The default position of the flagpole identifies the latest current actual data, as defined in the forecast setup
. You can drag the flag pole back to view the different data (from actual to forecast/budget). You cannot drag the flagpole forward past a certain period because you do not have any actuals for those periods (future periods).
Colored line - Identify the actual portion of the forecast.
Total Budget column - Click this column to display your budget values in the grid (the flagpole does not display). You can snap to budget (see below) to make the Total budget value equal to the Actual+Forecast value. The cells are not editable, the information is for reference purposes only.
Period columns (grid) - This is where the actuals, budget and/or forecast values display. Any formulas that were in the underlying budget workbook are retained in the forecast.
| Expand | ||
|---|---|---|
| ||
| Explore the forecast (1).mp4 |
| Tip |
|---|
In addition to the above elements, the forecast workbook also has some additional spread functionality. |
Sparklines in forecasts
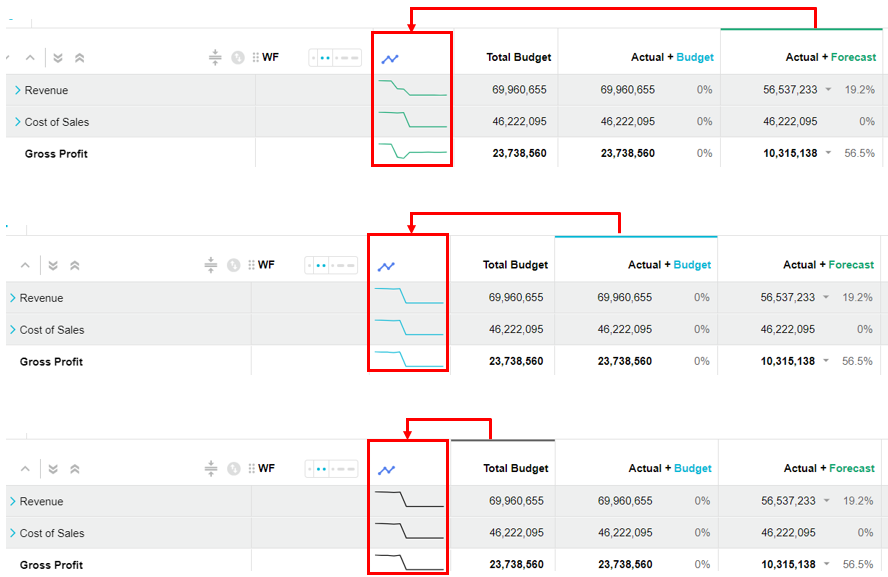
By default, sparklines display in budget and forecast worksheets. However, they behave a bit differently in forecasts. In a forecast, one sparkline column displays before the three total columns. This sparkline column is dynamic and each sparkline updates in real-time as you work with the forecast, such as:
When you select a total column, the corresponding sparkline displays in the sparkline column. When you select a different total column, the sparkline updates accordingly. The color of the sparkline denotes which total column it represents.
When you move the flagpole, the sparkline updates accordingly to reflect the values you see in the forecast grid at that point in time.
If you change the data in the grid, the sparkline updates instantly, so you can immediately see the impact of your changes.
 Image Added
Balance Sheet forecast
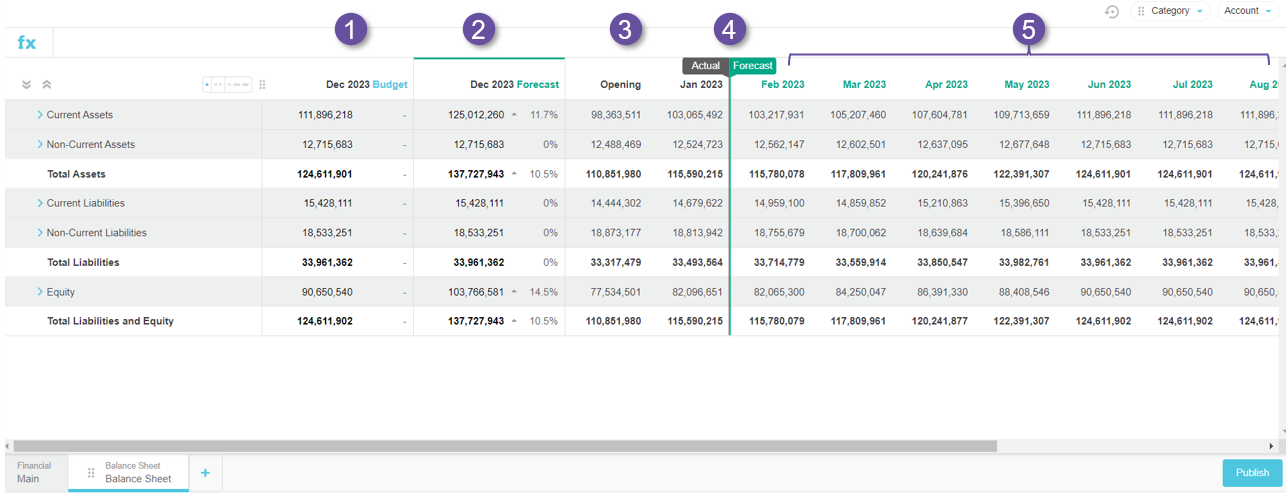
If the main budget workbook included a Balance Sheet budget, that budget is also converted into a forecast (as long as it was published first). It displays on its own tab and has a slightly different configuration to that of the Main tab in the forecast. As it does not make sense to total the values in the Balance Sheet, different information displays in the columns.
Budget column - Click this column to view the actual and
budget values for the entire period in the grid. The column itself references the values in the last column of the grid (last budget period). The actual values display to the left of the flagpole and the budget values display to the right. A dotted vertical line displays at the end of the
last fully completed month (period). The cells are not editable in this view, as the information is for reference purposes only.
This view is useful when you start reforecasting,
as you can use the flagpole to see what your original budget was.
| Tip |
|---|
The color of the column headers, flag pole and line changes, depending on the position of the flag pole and the total column that is selected, as illustrated in the images below. So you can easily determine if a column displays actual or forecast values. |
 Image Removed
Initially the cells in the forecast are black color to signify that they have not yet been edited but when you enter a forecast values, the cells change to blue.
The other change to note is that for working some and comparison lines we now show empty budget for actual plus budget totals. As there is no data for these cells.
there are several types of spread.
Related pages
Overview of the budget workbookForecast column - Click this column to view the actual and forecast values in the grid according to the period that was selected in the forecast setup, for example 1+11, 3+9 and so on. The actual values display to the left of the flagpole and the forecast values display to the right. A dotted vertical line displays at the end of the last fully completed month (period). You can edit the yellow cells.
Opening column - This column displays the opening balance, which is the first column before the budget period starts.
Flag pole - This tool allows you to switch between the different data. The default position of the flagpole identifies the latest current actual data, as defined in the forecast setup. You can drag the flag pole back to view the different data (from actual to forecast/budget). You cannot drag the flagpole forward past a certain period because you do not have any actuals for those periods (future periods).
Period columns (grid) - This is where the actuals, budget and/or forecast values display. Any formulas that were in the underlying budget workbook are retained in the forecast.
 Image Added
The rows in the Balance Sheet forecast are similar to those of the underlying budget. See Explore the Balance Sheet and Cash Flow budgets.
On this page
| Table of Contents | ||||||||||
|---|---|---|---|---|---|---|---|---|---|---|
|
Related pages
Spread totals (specific options for forecasts)