| Insert excerpt | ||||||||
|---|---|---|---|---|---|---|---|---|
|
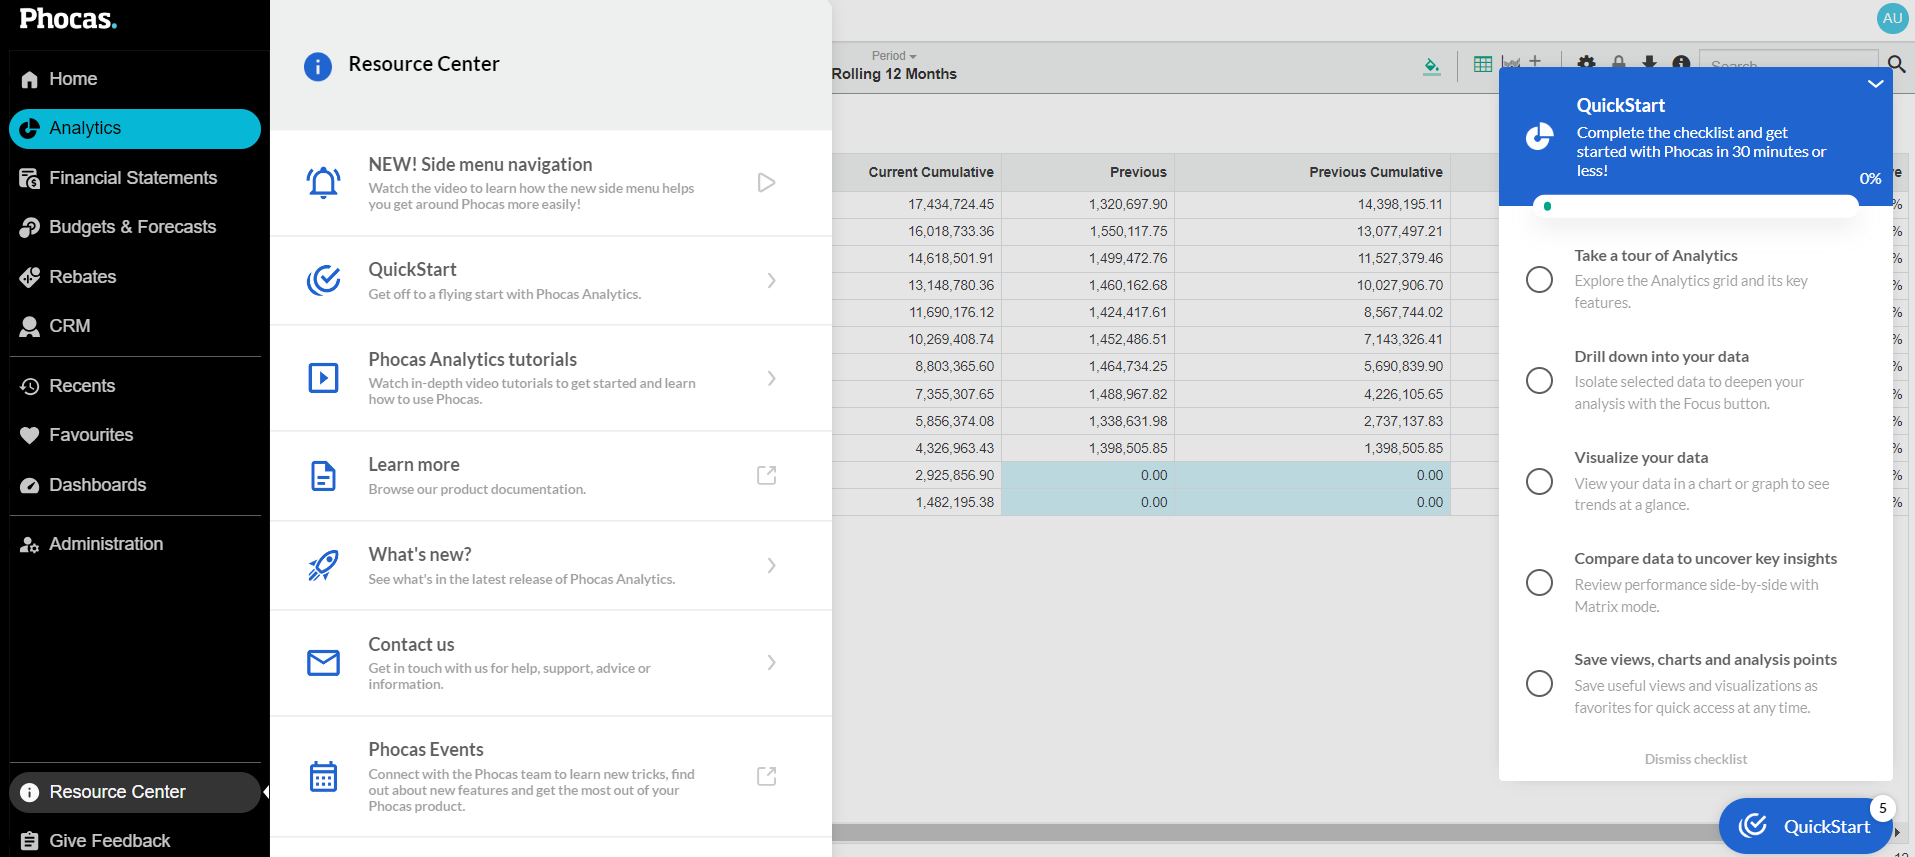
The best place to quickly get started with Phocas Analytics is our Resource Center in Phocas. When you open an Analytics database for the first time, the QuickStart feature displays on the bottom-right side of your screen. It contains a checklist with guided tours that step you through the basics. At any time, you can click the Resource Center button near the bottom of the Phocas menu on the left to access other helpful links.

For detailed steps, click on the links below.
Take a tour of Analytics - Explore the Analytics grid and its key features.
Drill down into your data - Isolate selected data to deepen your analysis with the Focus feature.
Compare data to uncover key insights - Review the performance of regions, products, customers and more side-by-side with Matrix mode.
Visualize your data - View your data in a chart or graph to see trends at a glance.
Save views, charts and analysis points - Save useful views and visualizations as favorites for quick access at any time.
| Panel | ||
|---|---|---|
| ||
Prefer videos? Watch the Phocas QuickStart: Analytics videos in the Academy. |