| Info |
|---|
The Stream mode is only available when streams exist for the database and dimension you have selected. |
Stream mode allows you to compare multiple streams of data (datasets) side-by-side, such as your sales vs. budget or sales vs. orders. When you select the Stream mode, the Variance Stream menu becomes available on the right of the Stream menu. You use these two menus to control which data streams display in the grid. You can select multiple variance streams.
Stream mode in Summary view
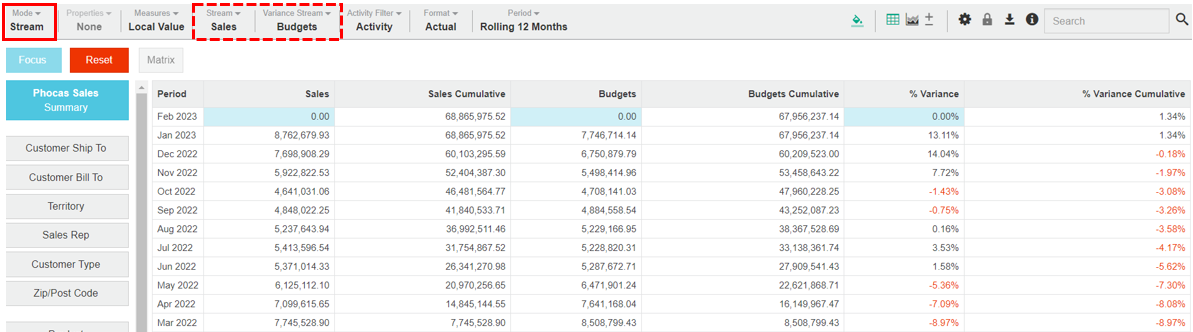
In Summary view, the grid displays the relevant time unit (day/month/year) within the current period, plus the following columns: stream (such as Sales), stream cumulative, variance stream (such as Budget), variance stream cumulative, % Variance and % Variance Cumulative.

Stream mode in a filtered view
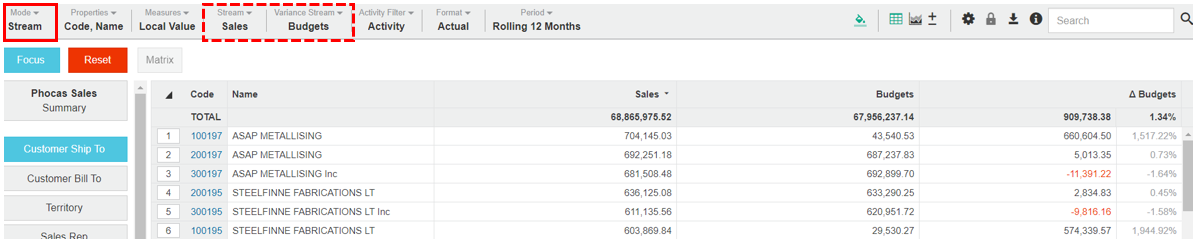
When you select a dimension, the grid displays columns for the active properties (such as Code and Name) for that dimension plus columns for the stream, variance stream, variance and percentage variance. The delta (triangle) icon ![]() indicates a change or difference.
indicates a change or difference.

Example 1 - Use Stream mode to compare two streams
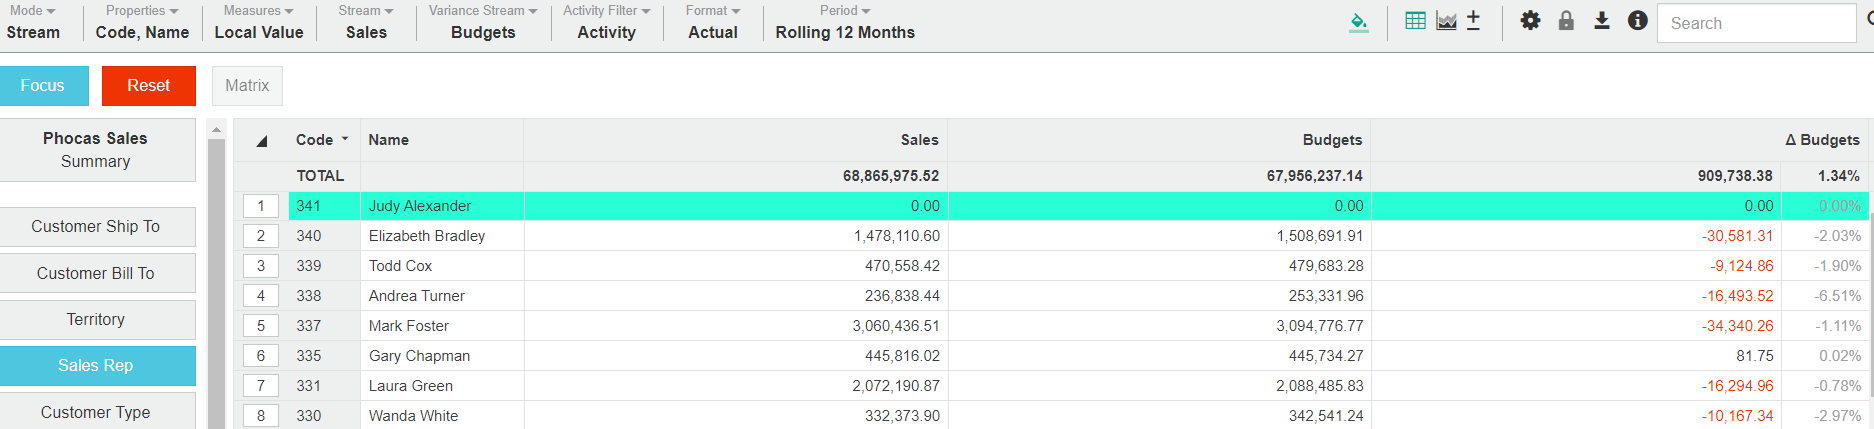
Use stream mode to compare a Sales Rep's performance against the sales budget:
Click Mode > Stream.
Click the Sales Rep dimension.
Click Stream > Sales.
Click Variance Stream > Budget, then click out of the menu. The grid updates to display the Sales Rep data from the two streams, along with the variance between them (as an amount and percentage), for the selected period (in this case it's rolling 12 months).
Example 2 - Use Stream mode to compare multiple streams
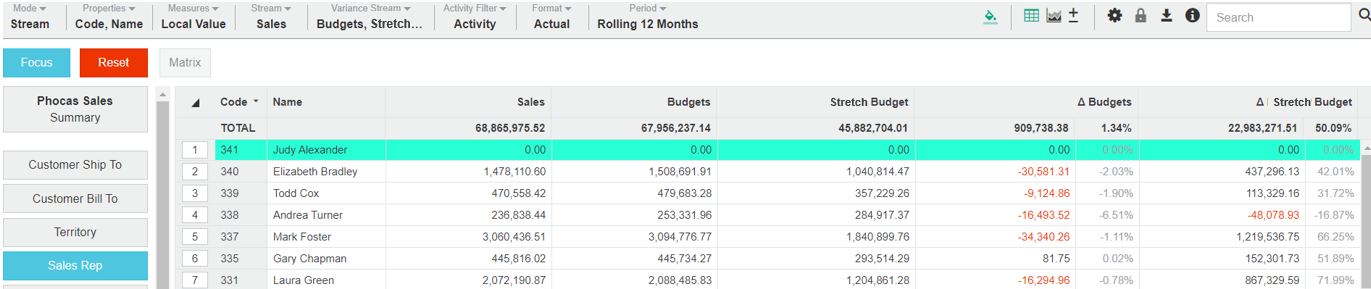
Use stream mode to compare a Sales Rep's performance against multiple streams: Following on from the example above, click Variance Stream > Stretch Budget (leave Budget selected) then click out of the menu.
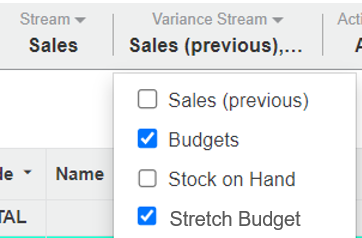
The grid updates to display both the Budget and the Stretch Budget data, and variance columns displaying the difference between Sales and Budget and the difference between Sales and Stretch Budget.
| Tip |
|---|
To see your results in a chart, switch to chart view and select the appropriate chart type. For best results when viewing multiple streams, first select Summary view, then switch to chart view and select line chart. |
Example 3 - Use Stream mode with historical data
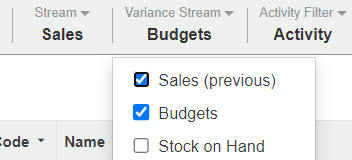
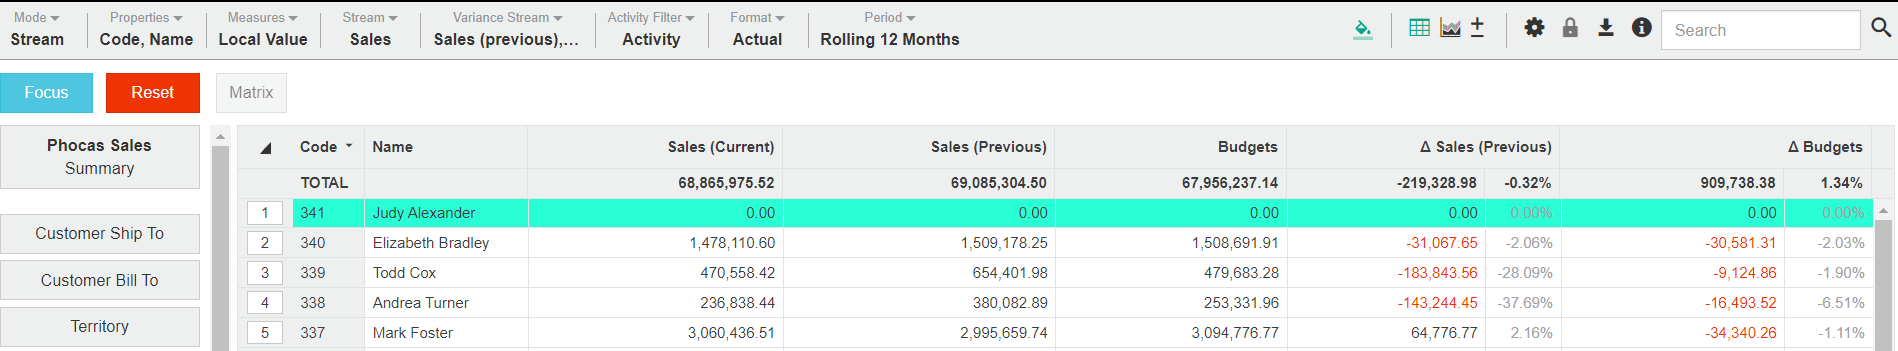
Use Stream mode to introduce historical data into the comparison: Following from the example 1 above, click Variance Stream > Sales (previous) then click out of the menu.
The grid updates to display a combination of current and previous data, along with the comparison stream.
On this page
| Table of Contents | ||||
|---|---|---|---|---|
|
Related pages
| Panel | ||
|---|---|---|
| ||
Videos |