| Info |
|---|
You must select a dimension to activate this mode; it is not available in Summary view. |
Variance mode is the easiest way for you to compare current and previous results for a selected dimension. It works in conjunction with the Period function (menu) to display comparative data for selected time periods. For example, you might want to compare the sales of a product this year vs. last year, or this quarter vs. last quarter.Even though this mode is not available in Summary view initially, you can view the variance at the summary level afterwards (see below).
When you select a dimension and select Variance mode, the grid displays columns for the active properties (such as Code and Name) for the selected dimension, along with columns for the Current and Previous periods, and the Variance and % Variance.
| Excerpt |
|---|
Learn about how the variance is calculated
|
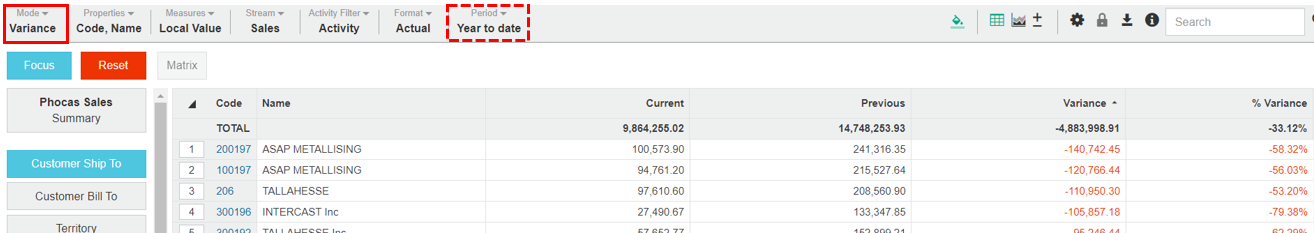
Example 1 - Use Variance mode to identify declining customers
Use Variance mode to identify customers who have spent less this year than they did last year.
Click the Customer dimension.
Click Mode > Variance.
Select Period > Year to date.
Sort the Variance column in ascending order. The grid updates to display the sales of each customer, with the worst performers at the top of the list. You can now compare each customer's performance against last year.
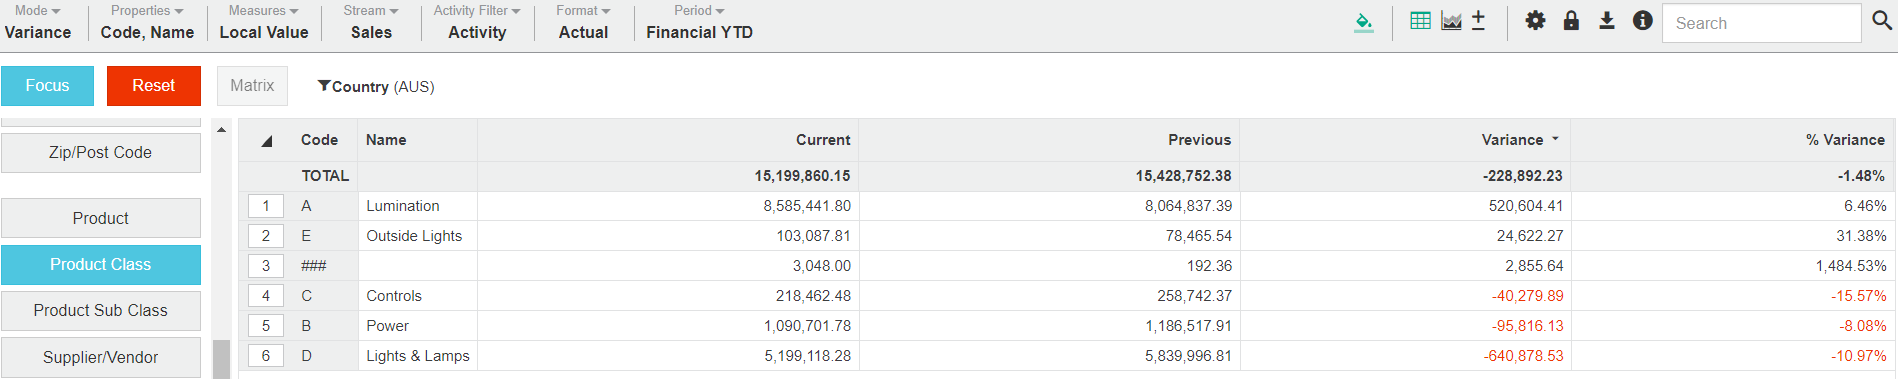
Example 2 - Use Variance mode to investigate product performance in a country
Use Variance mode to investigate how this year's product sales in Australia compare with last year.
Click the Country dimension, select the AUS (Australia) row, then click the Focus button.
Click the Product Class dimension
Click Mode > Variance.
Select Period > Financial YTD (year to date).
Sort the Variance column in descending order. The grid updates to display the sales of each product class in Australia, with the product that has the greatest positive variance at the top. You can now compare the performance of each product class against last year.
View the variance at the summary level
When you use Variance mode, as in the examples above, you can click the Summary button to go to the summary view. The grid updates to display the variance at a high level.
Example 1 - Sales so far this year, compared to the same time last year

Example 2 - Sales in Australia compared to last year

On this page
| Table of Contents | ||||
|---|---|---|---|---|
|