in Phocas quickly to activity e.g.CRM dashboard
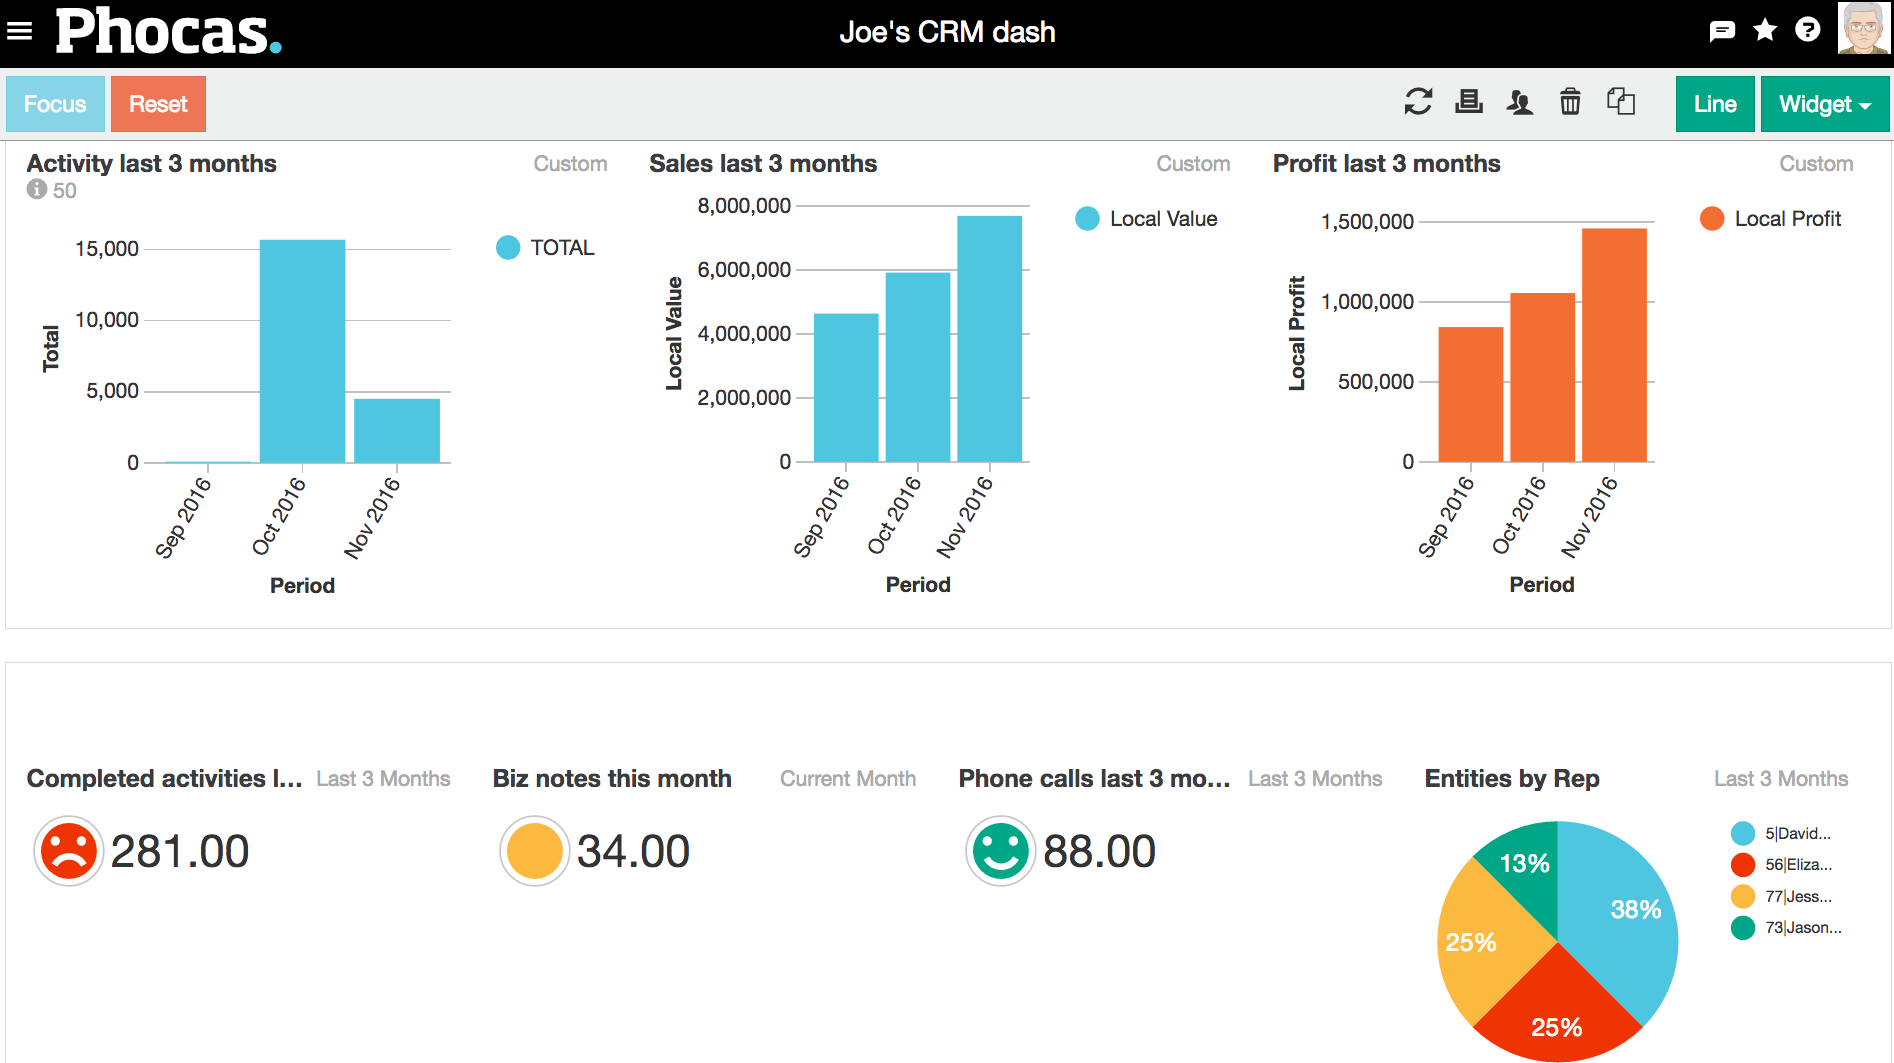
You can analyze sales results alongside CRM activity on a dashboard. The image below shows a simple CRM dashboard.
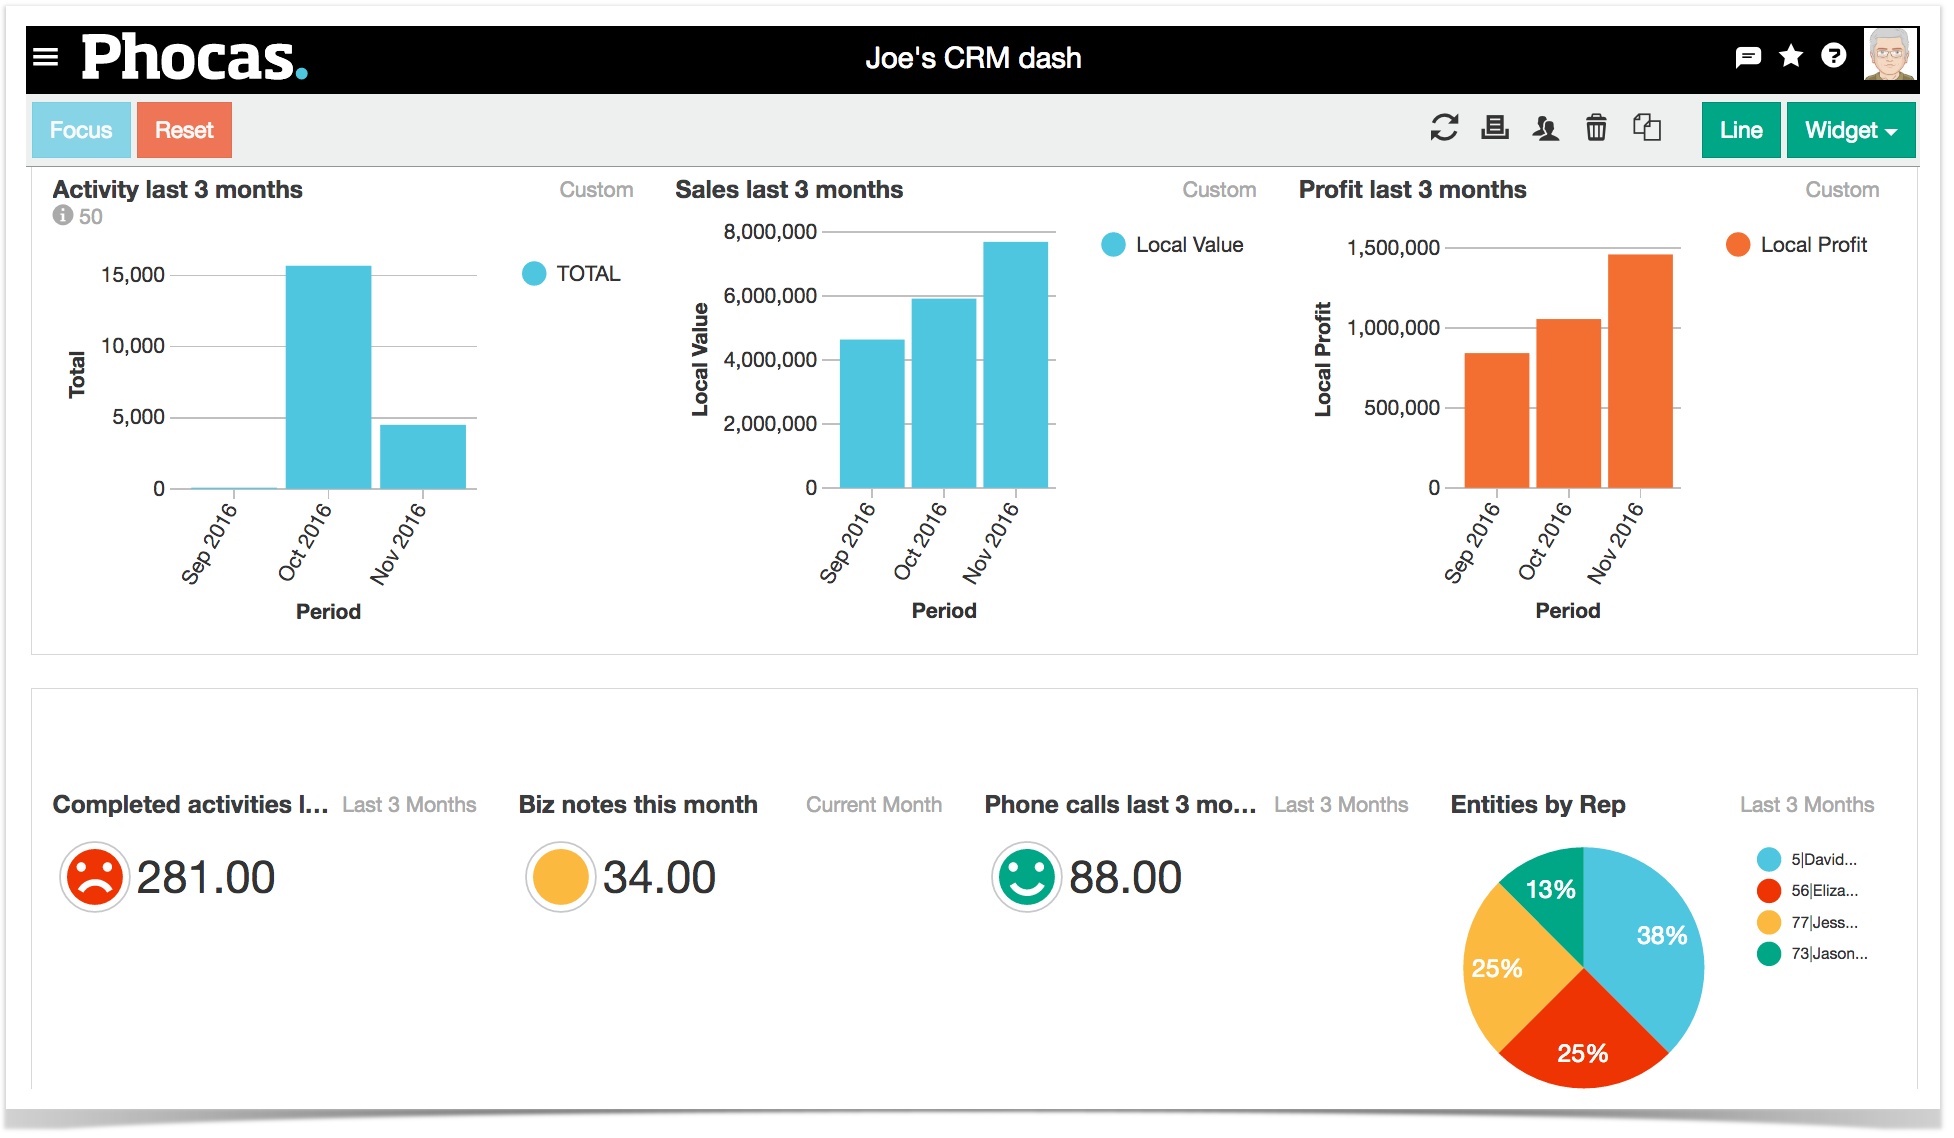 Image Removed
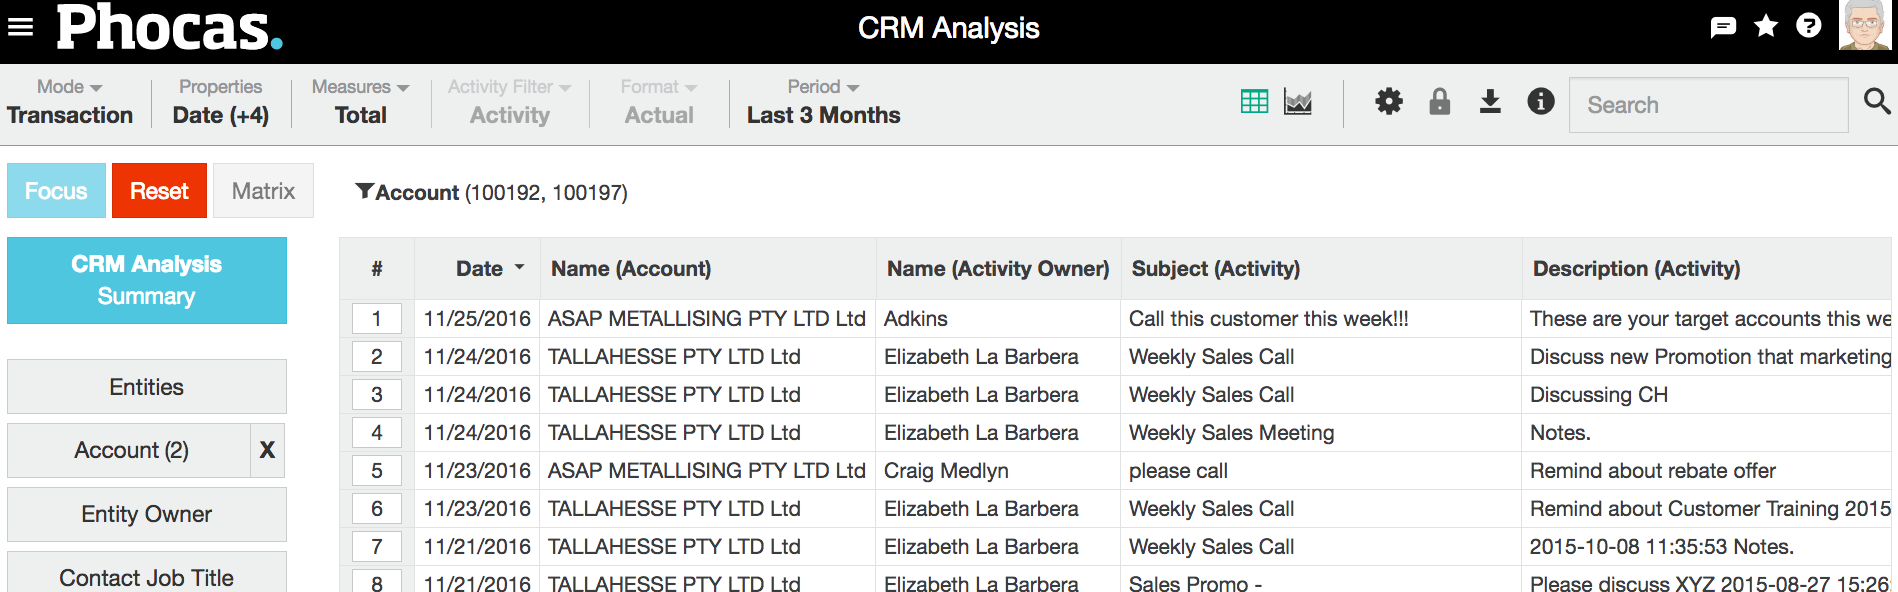
CRM analysis database
will , as shown 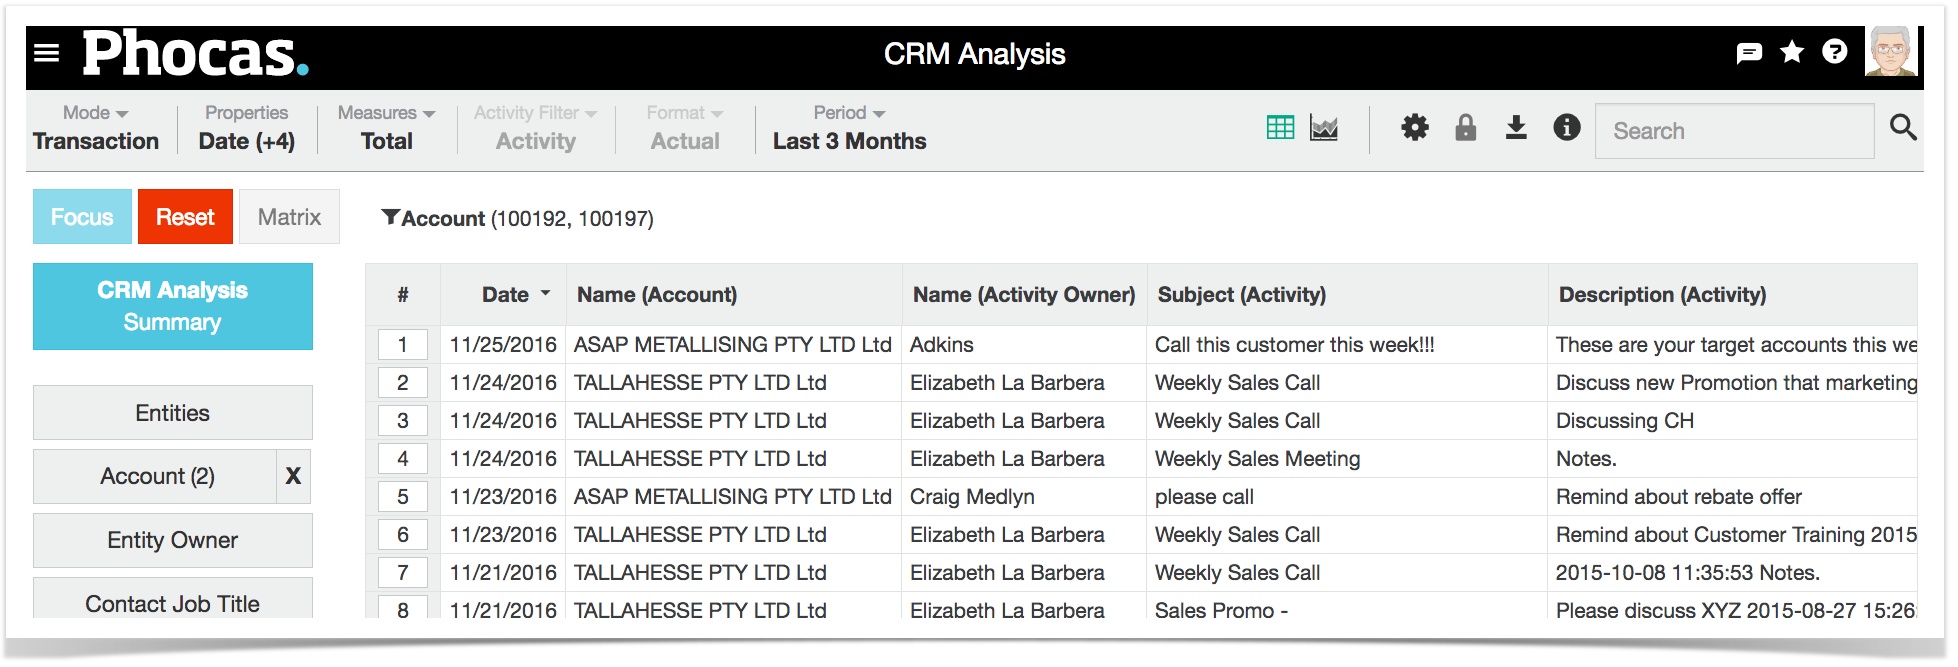 Image Removed
Note: The CRM analysis database is often tailored to suit individual businesses, so may look different to what is shown here. You may need to contact your administrator to gain access to the CRM database.
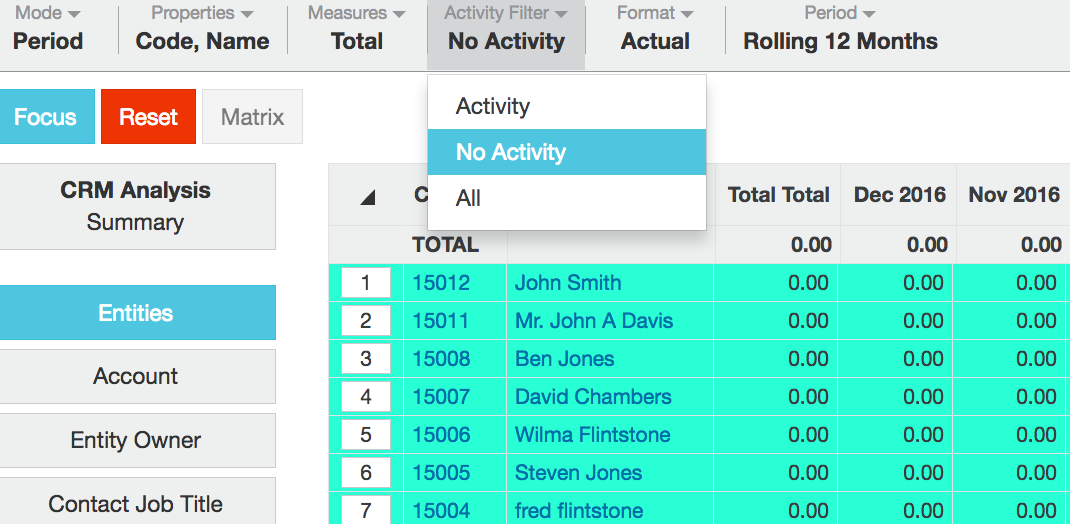
ExamplesSelect your '' 'no activity will appear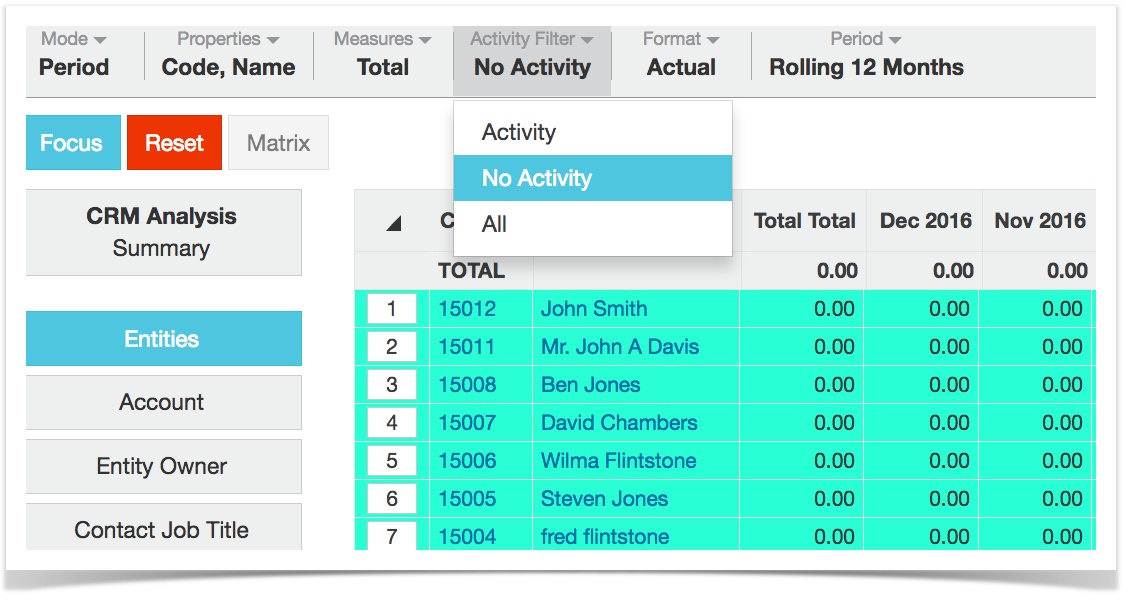 Image Removed: Step 1. .
- Select New dashboard from the main menu.
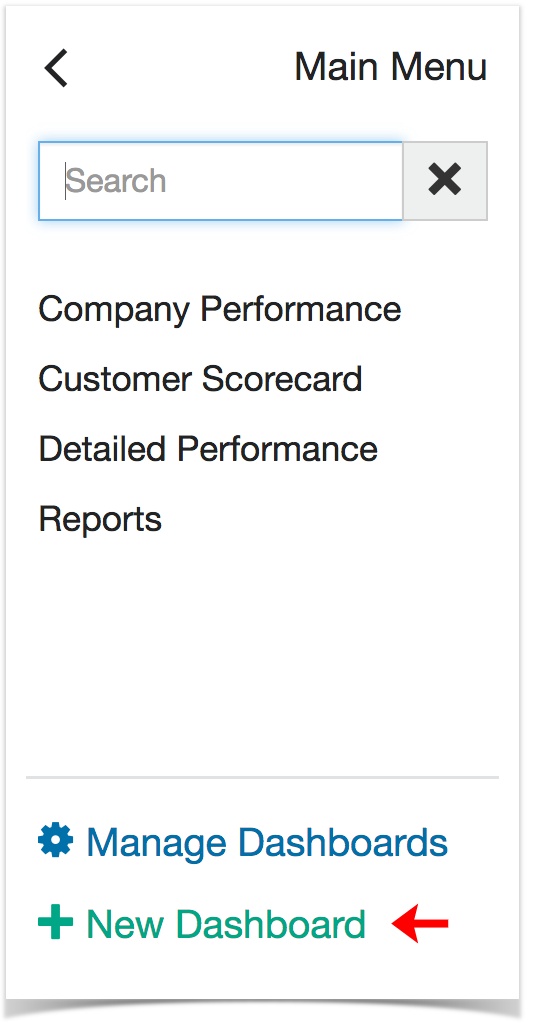 Image Removed
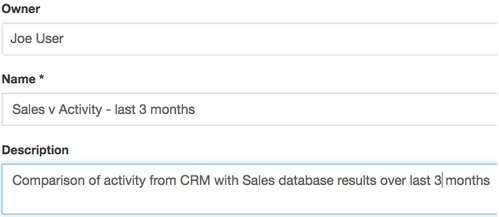
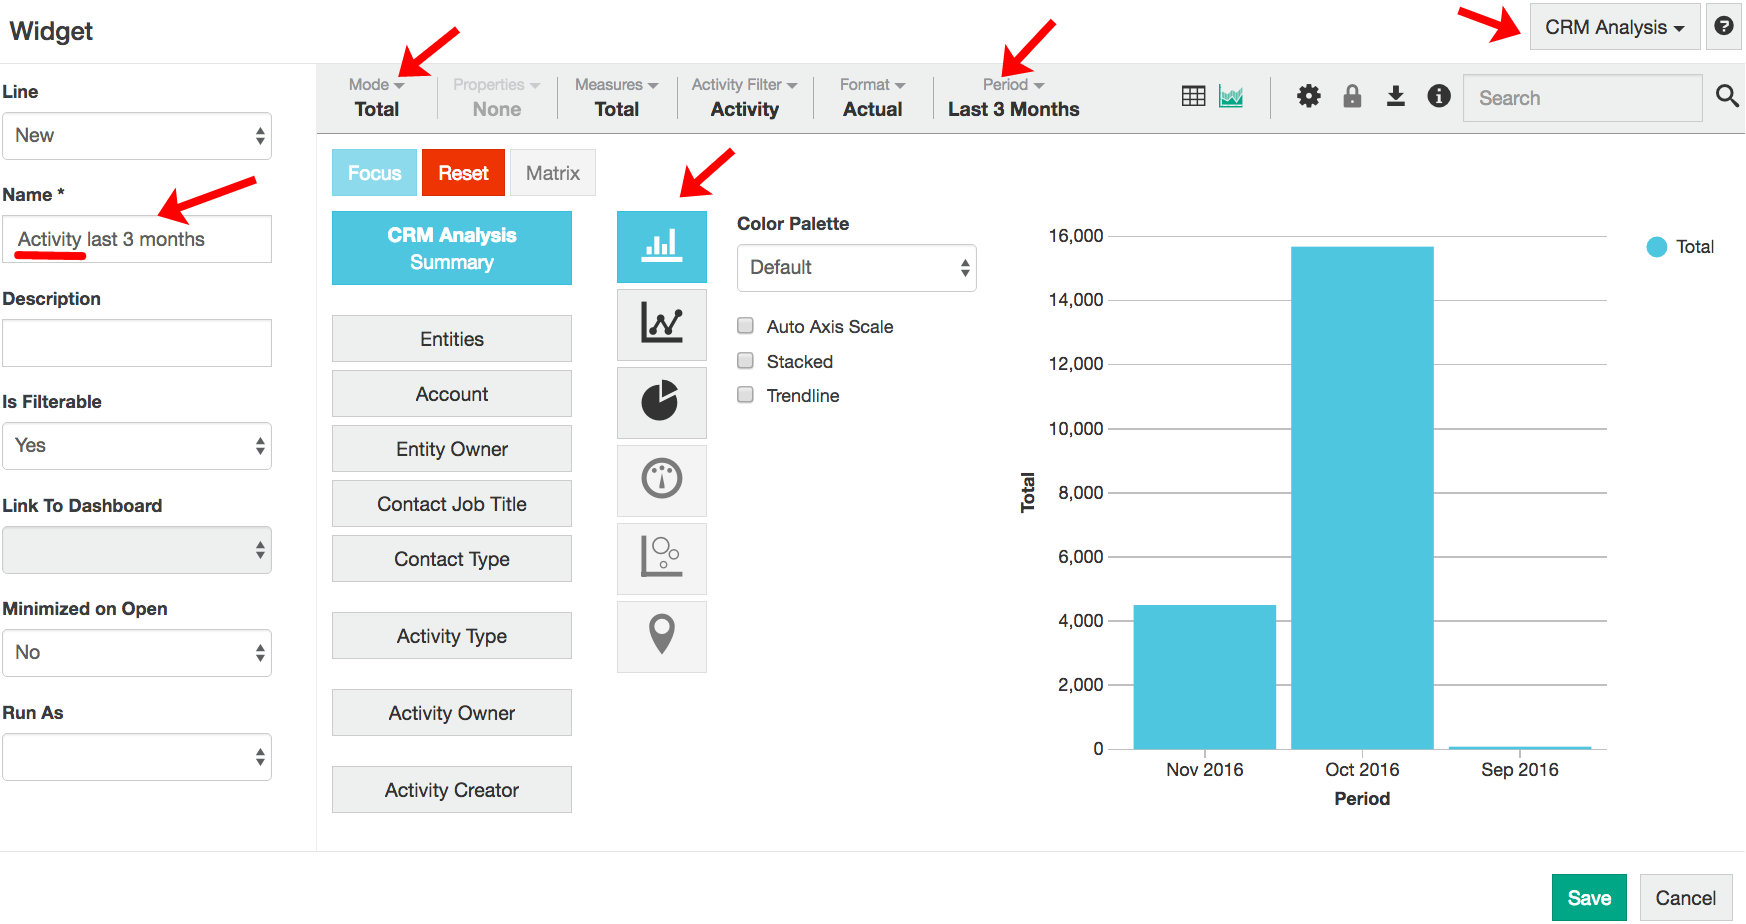
Name your dashboard ''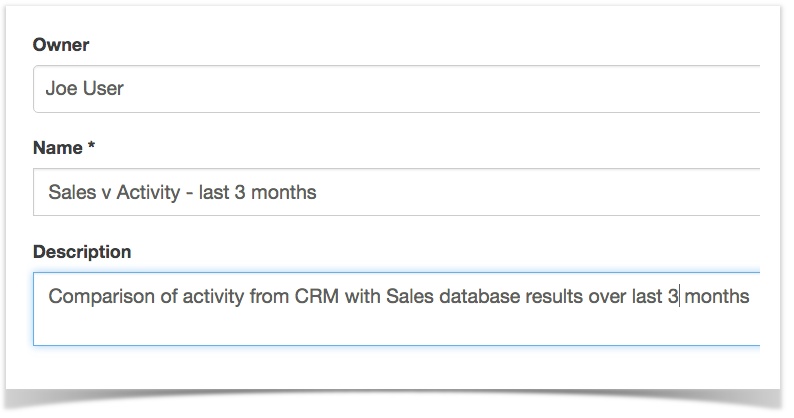 Image Removed Save. Your will openStep 2. Create ()Select queryChoose '' Select icon, and choose column chart.Name '' and will appear that you created
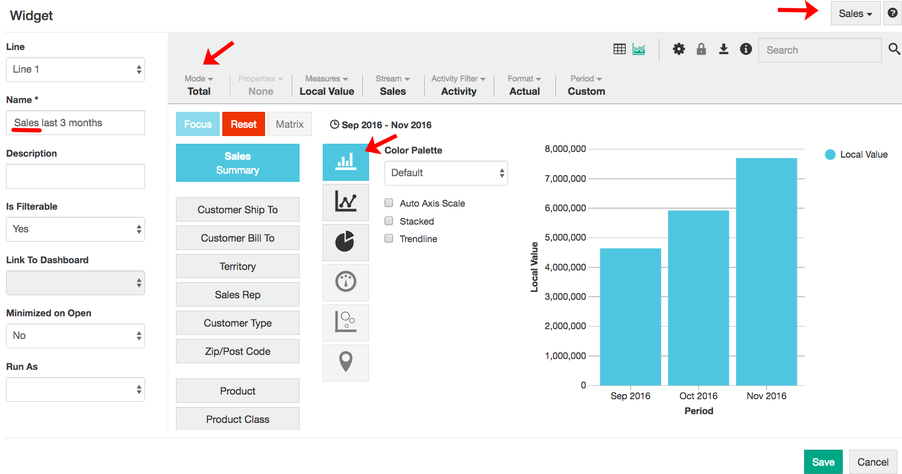
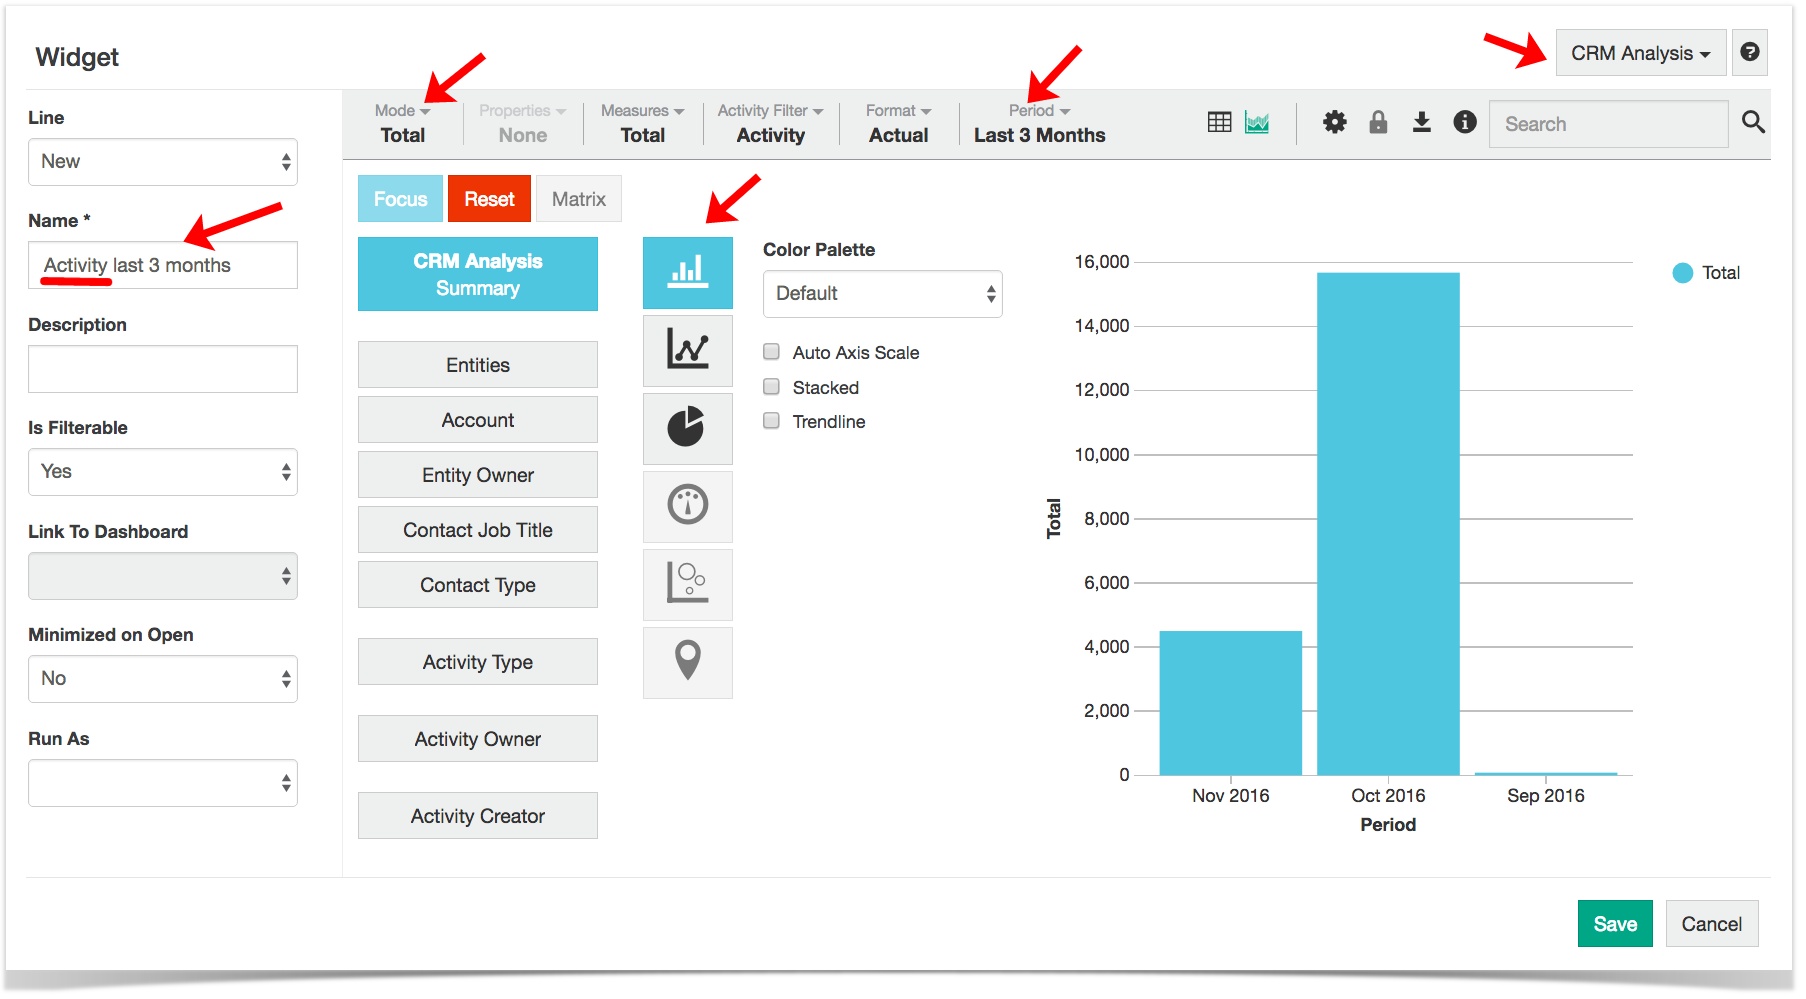 Image RemovedStep 3. ( database).Select Widget > queryChoose '' Select icon, and choose column chart.Name the chart '', and This will appear same Step 3. View
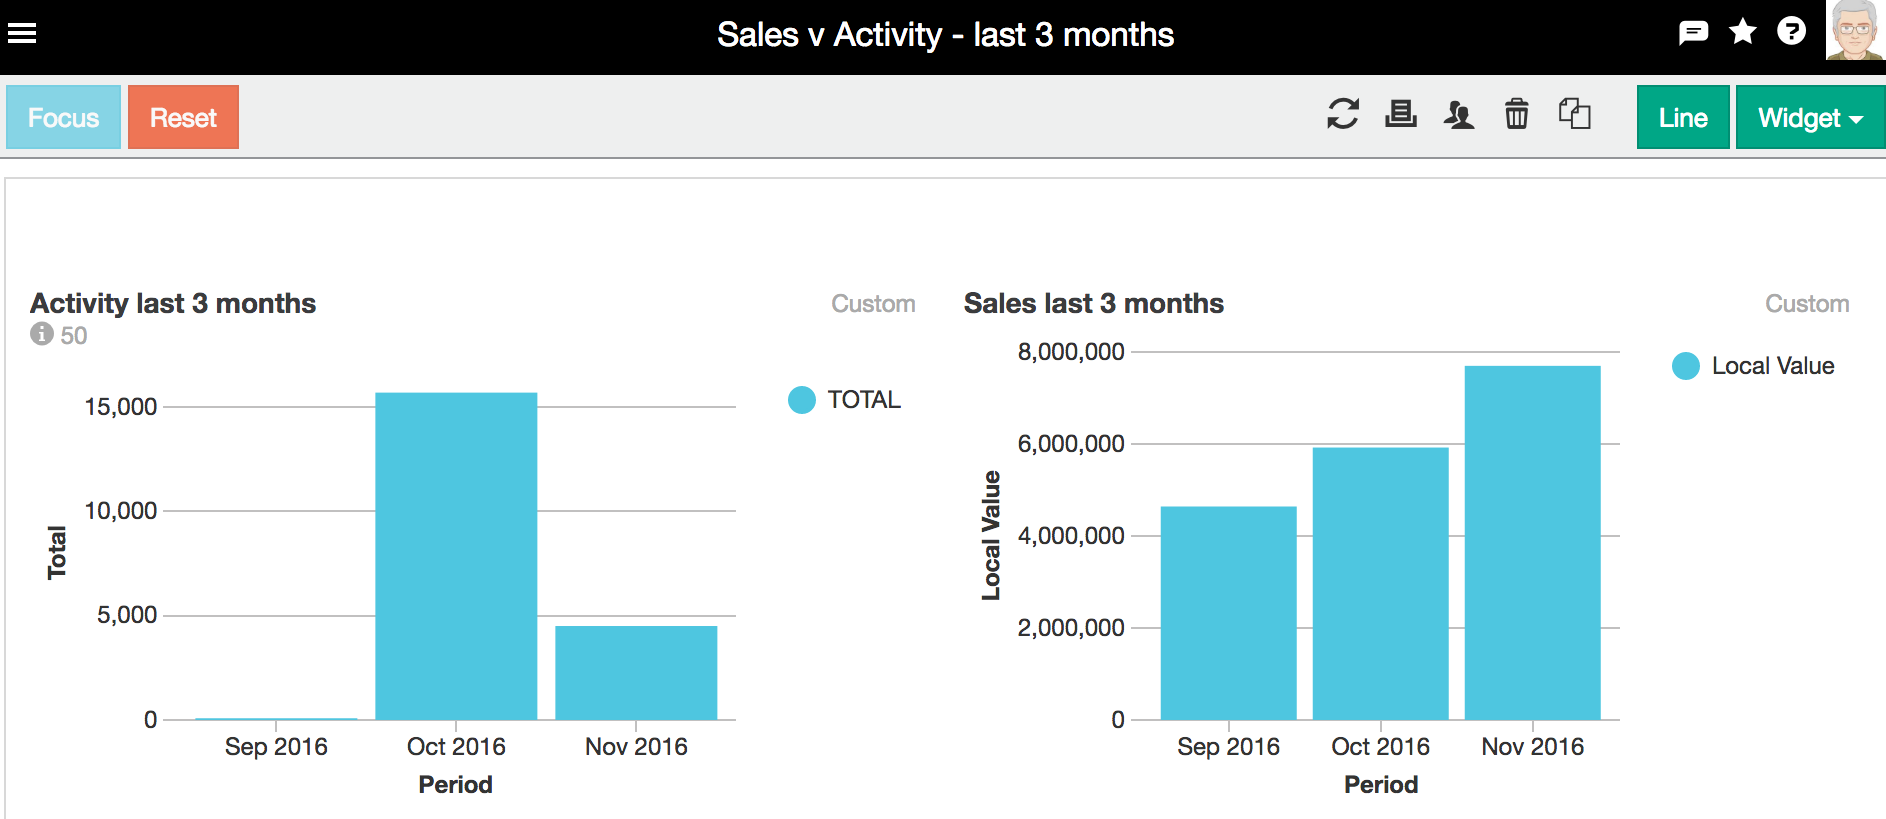
 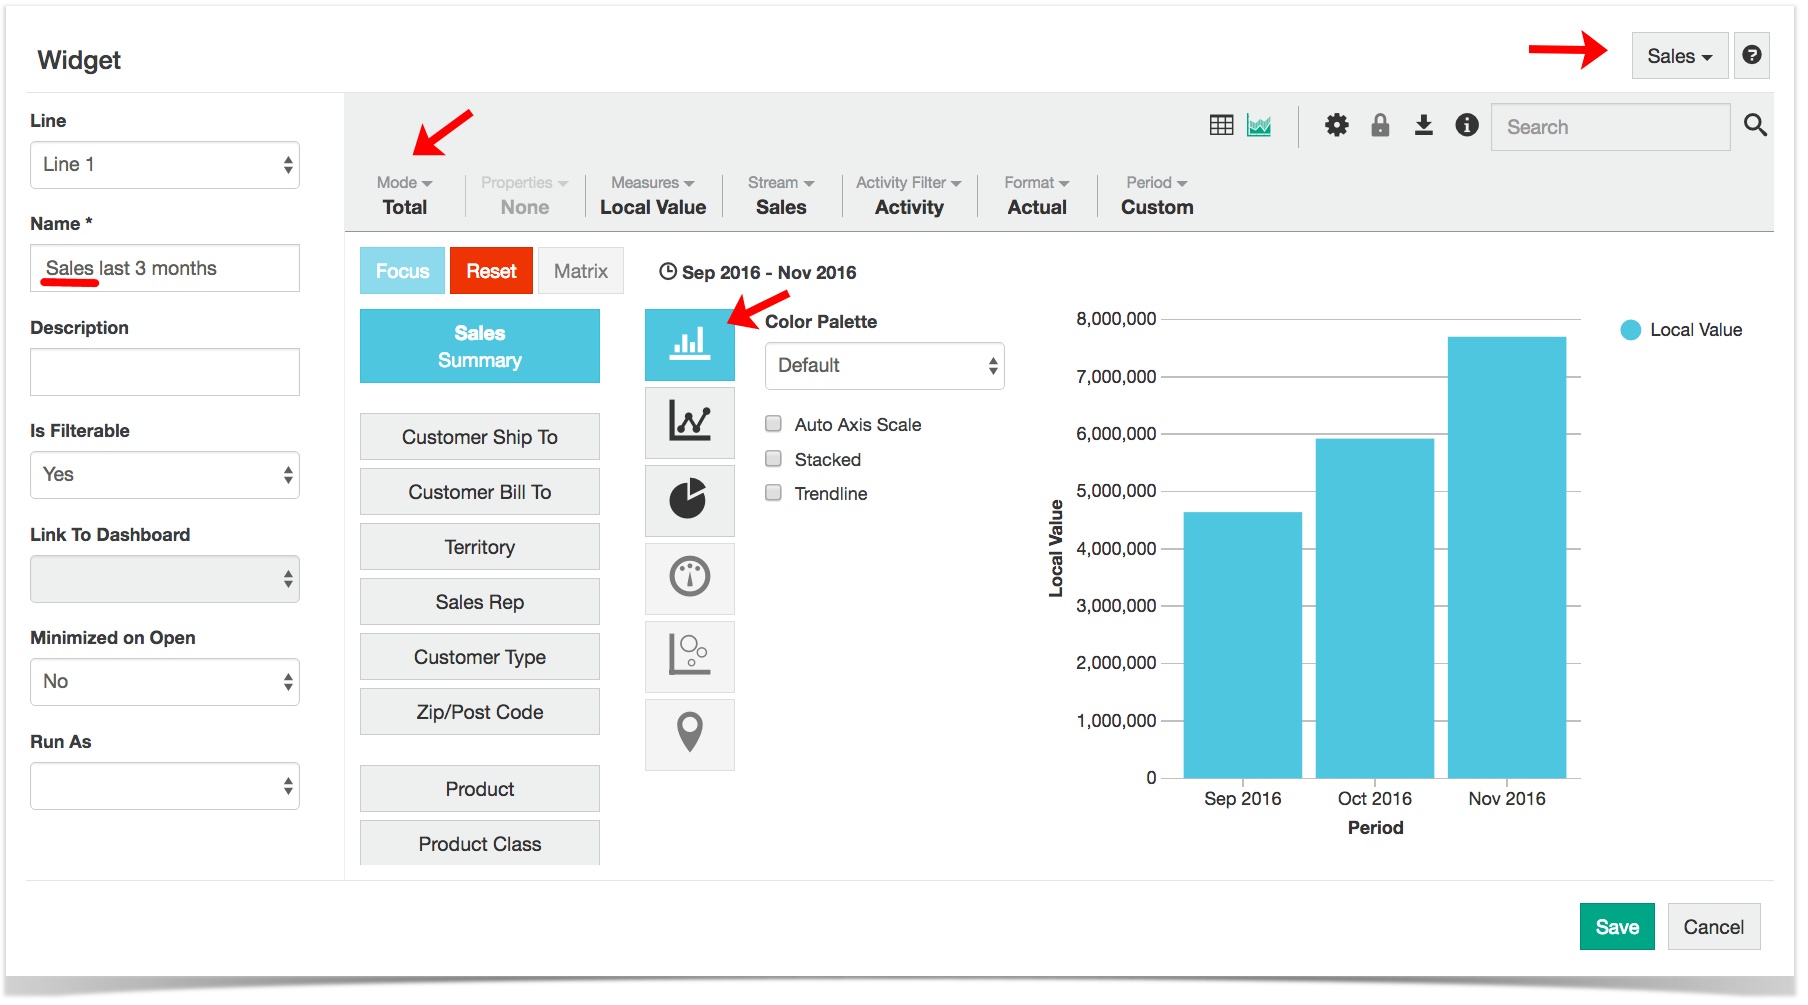 Image RemovedYou can now view the charts to we will be following up with sales team, as the
 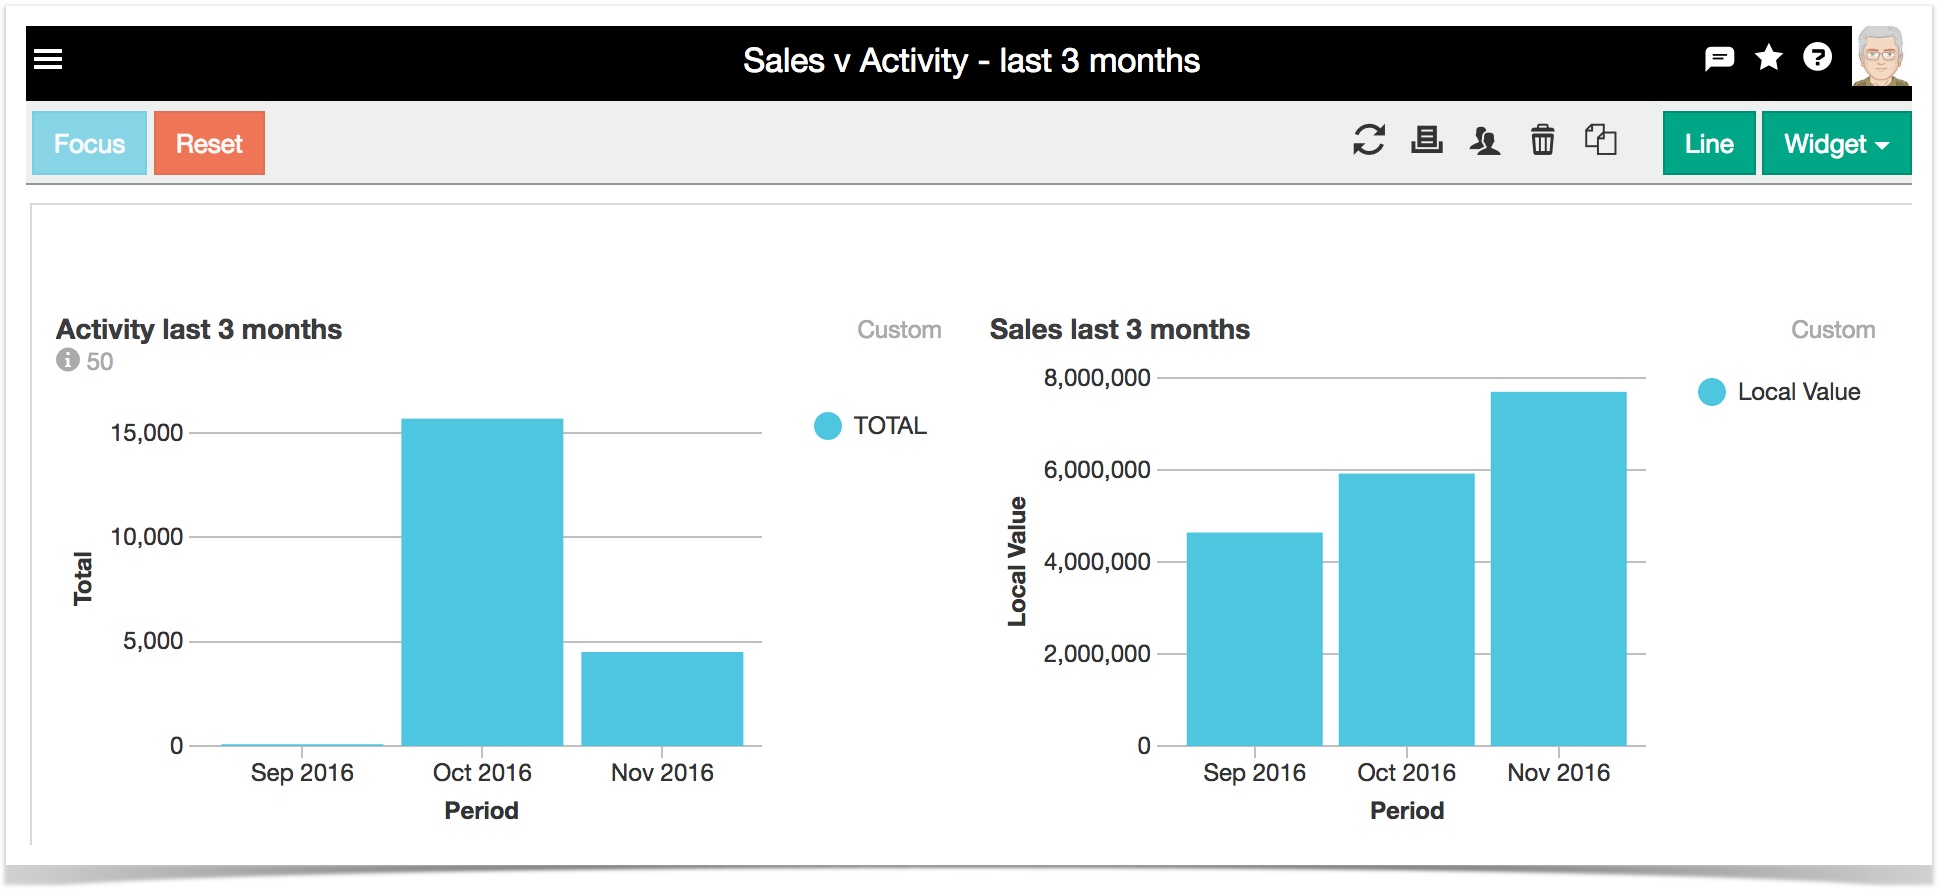 Image Removed