Measures are different types of numerical data values, such as Revenue or Quantity, that display in the grid.
Measures will be either calculated or non-calculated (raw data). Expand the section below to view a list of the typical measures you might see in a Sales database.
| Expand | |||||||||||||||||||||||||||||
|---|---|---|---|---|---|---|---|---|---|---|---|---|---|---|---|---|---|---|---|---|---|---|---|---|---|---|---|---|---|
| |||||||||||||||||||||||||||||
Typical measures you might see in a Sales database are listed below. The measures you have might be different to these.
|
When you first open a database or reset the data during your analysis, the default measure is selected and applied for you. This measure displays at the top of the list in the Measures menu. Typically, in a Sales database, the default measure is Value.
| Tip |
|---|
The Measures menu label identifies the selected measure. If multiple measures are selected, a summary displays. You can hover over the Measures menu to display a tooltip listing all the selected measures. |
View measures in Summary view
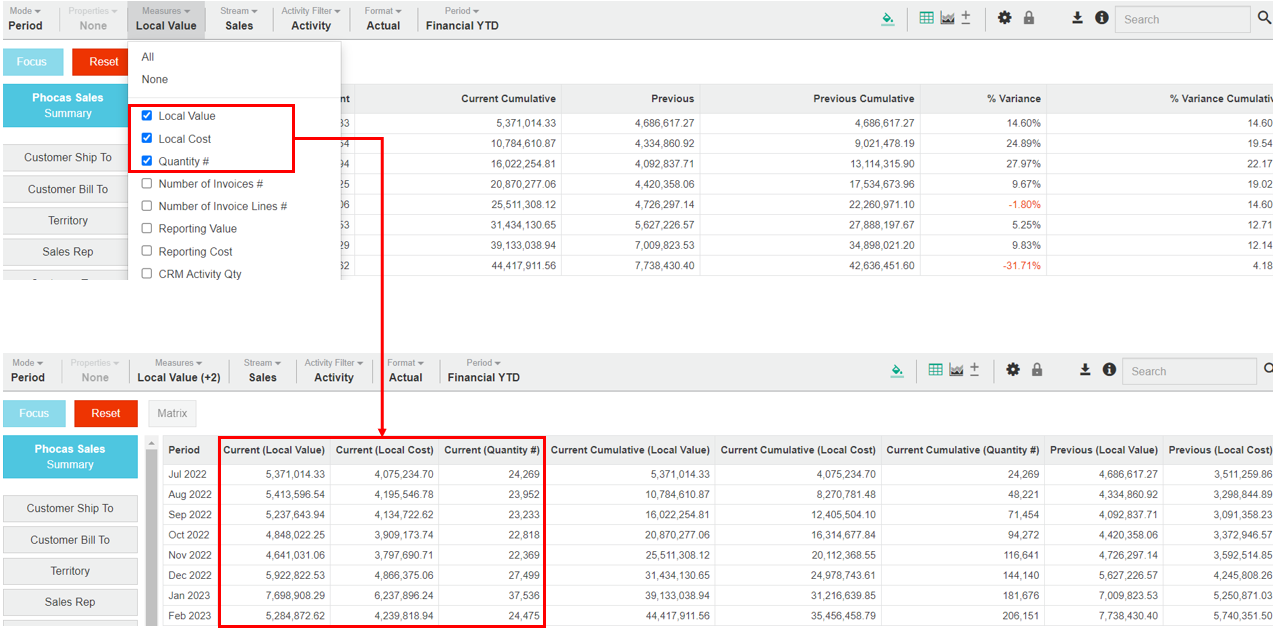
In Summary view, the values you see in the grid correspond to the default measure, so you can see a summary of that measure (Local Values) across the period. You can switch to a different measure, such as Cost or add multiple measures columns to the grid to view all of those high-level data values.
View measures in a filtered view
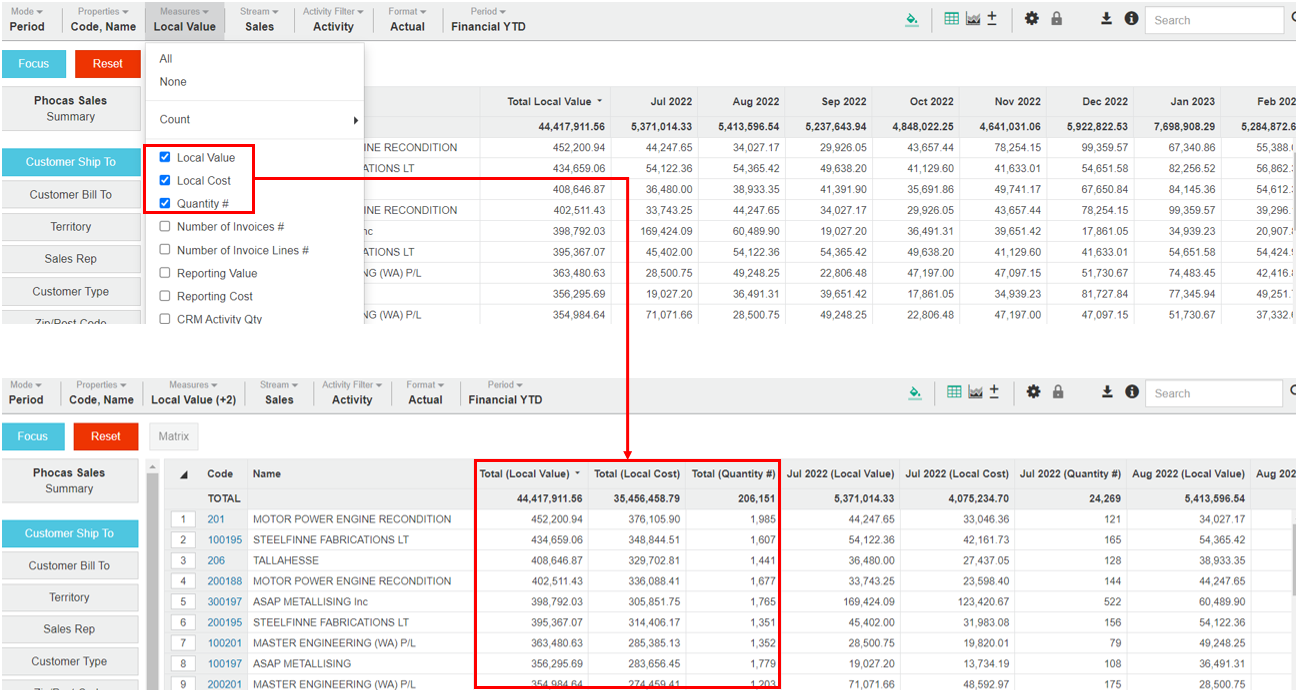
When you select a dimension, the grid displays columns for the active properties (such as Code and Name) for that dimension, along with additional columns displaying data for the default measure. The columns that display depend on the selected mode. If you select more than one measure, more columns will display.
In the context of a filtered view, the measures are data values relating to the selected dimension. You can switch to a different measure or add multiple measures to view those additional data values in the grid.
Add and remove measure columns
The Measures menu has a list of all the measures in the database, however, only the measures that contain data are available for selection. Typically, in a Sales stream, all measures are available but if, for example, you switch to a Budget stream, you will see that your choice of measures is limited.
When you are in an advanced search or Custom mode, all measures are available (even if they don't contain any data).
In Summary view or when you have selected a dimension (as applicable), click the Measures menu.
Select the checkboxes of the measures you want to add to the grid and clear the checkboxes of the measures you do NOT want.
Click anywhere outside the Measures menu to update the grid and view the new measures.
| Tip |
|---|
To quickly select and apply one measure only, double click that measure in the list. |
| Info |
|---|
If you select multiple measures:
|
Format a measure
| Excerpt | ||
|---|---|---|
| ||
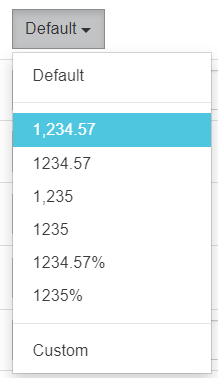
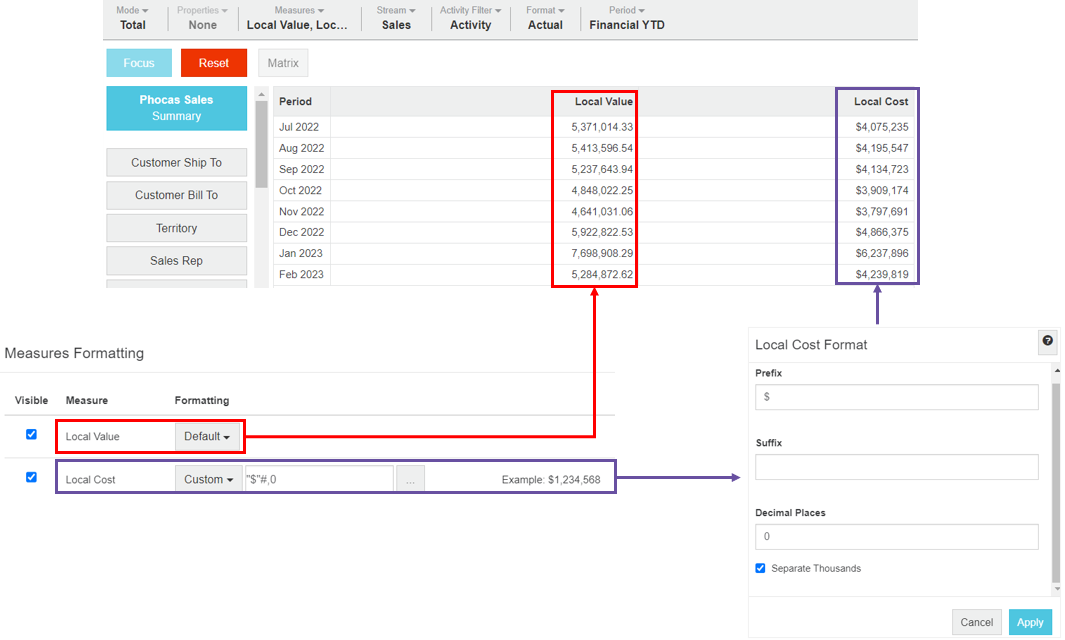
By default, the measures display in the format your administrator set in the Designer module. You can override this format and customize the appearance of the measures to meet your personal needs. You can select from a list of predefined format options, which include the use of decimal places, thousand separators, and percentage symbols. If none of those options meet your needs exactly, you can create a custom format that can contain a prefix and/or suffix, such as a currency symbol. For example, you might want to remove the thousands to save space in the grid, so 4,000 becomes 4, 57,300 becomes 57.3, and so on.
|
In the image below, compare the default appearance of data in the Local Value column with the customized format of the data in the Local Cost column (it has dollar signs and no decimal places).
Hide a measure
| Excerpt | ||
|---|---|---|
| ||
By default, all measures are set to Visible, so they display in the list in the Measures menu. You have the option to set a measure as NOT visible, in other words, hide the measure from the list. This option is useful when the database has a lot of measures and therefore, the list of measures is very long but you are only ever interested in some of those measures. You can remove the redundant measures from the list, so you can find the ones you want more easily. Click the Measures > Formatting and clear (deselect) the Visible checkbox for the measure. 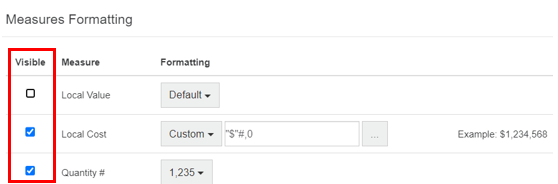 |
Define a measure
| Info |
|---|
The information in this section relates to other Phocas functions and is referenced by other user documentation pages. |
When you use Custom mode and create some advanced search rules, you need todefine a measure by applying parameters such as time period, stream, format and filter selections.
The first thing to be aware of is the Measure button will not say Measure on its label. It will be named differently depending on the default measure set in the database you are in. For example, if you are in a Sales database this button will say something like Sales Local Value. However, when you hover over the button it displays Measure in a tooltip.
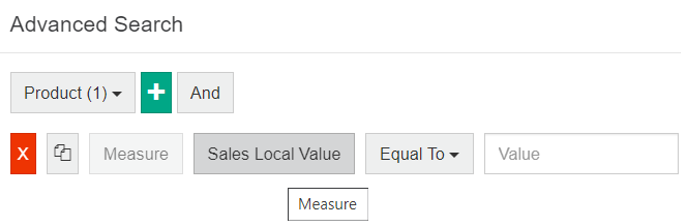
When you click the Measure button, the Measure window displays. This is where you define the measure, using the settings that are organized into three tabs. The combination of these settings determines the value of the measure.
Measure | Period | Selections | ||
|---|---|---|---|---|
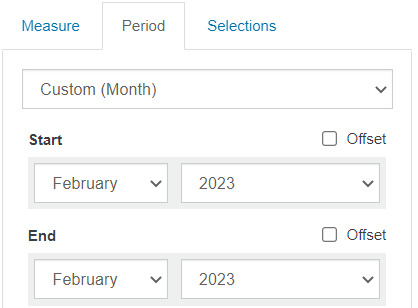
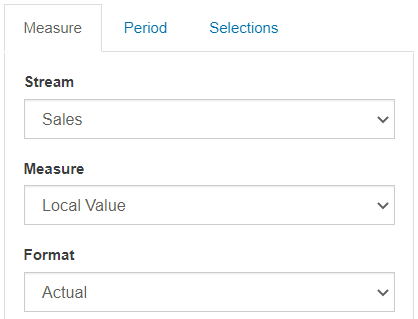 | This optional setting allows you to add a time period to a measure. If you skip this option, either the default or active period will apply to your measure.
 | This optional setting allows you to further refine the measure by making additional selections on a dimension to act as a filter for the values being calculated.
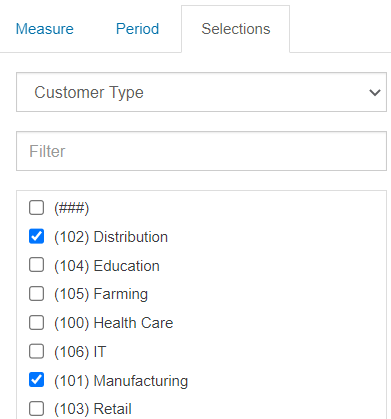
|
Add a Count column
The Count feature displays specific count results as another measure column in the grid. Adding a ‘count’ column is simple way to see totals related to a dimension, such as the number of products customers are buying or the number of customers in a region.
| Info |
|---|
The Count feature is available in Total, Period, Variance and Stream modes, when you have selected a dimension. |
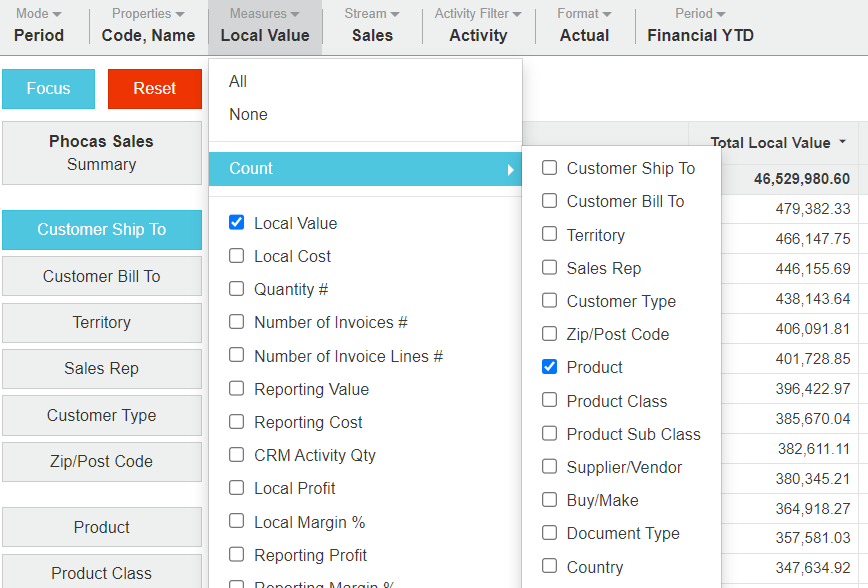
In the following example, you add count columns to identify how many products were bought by each customer.
Click the Customer dimension.
Click Mode > Total.
Click Measures > Count and select Product. The options in the Count list are the same as the dimensions that you see down the left-hand side of the grid. This is because Phocas is counting entities within the datasets that make up dimensions.
Click anywhere outside the Measures menu to update the grid and view the new Count column.
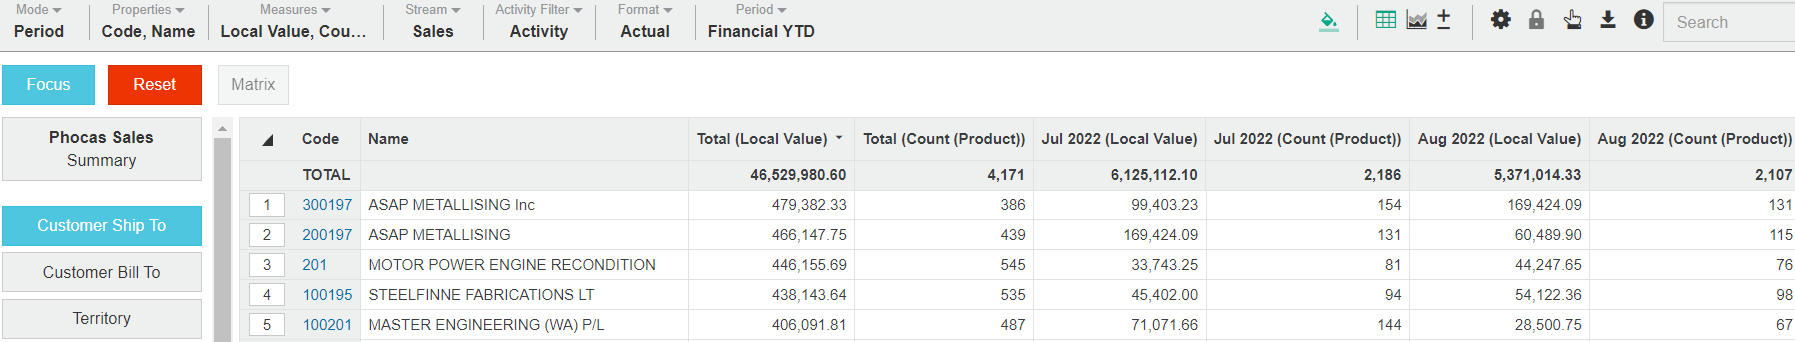
(Optional) Visualize the data in a chart or save your view as a favorite.
| Info |
|---|
Limitation: If you add a ‘count’ widget to a dashboard, you should not make it filterable, as it may not perform as expected. |
| Excerpt | ||
|---|---|---|
| ||
Troubleshooting: Missing measuresIf you are unable to view specific measures in the grid, it might be due to one of these reasons:
|
On this page
| Table of Contents | ||||
|---|---|---|---|---|
|