What is market mode?
Market mode can be used to show market penetration. , '' , could
2. Select market mode
Choose Mode > Market. Three things will occur:
The selections you just made are displayed next to the word 'market' in the status bar.
The selections you just made will function in a similar manner to lock selections. That is, they no longer appear on the dimension button(s).
The grid will change, with Market, Segment and % of Market columns being added (for each measure)
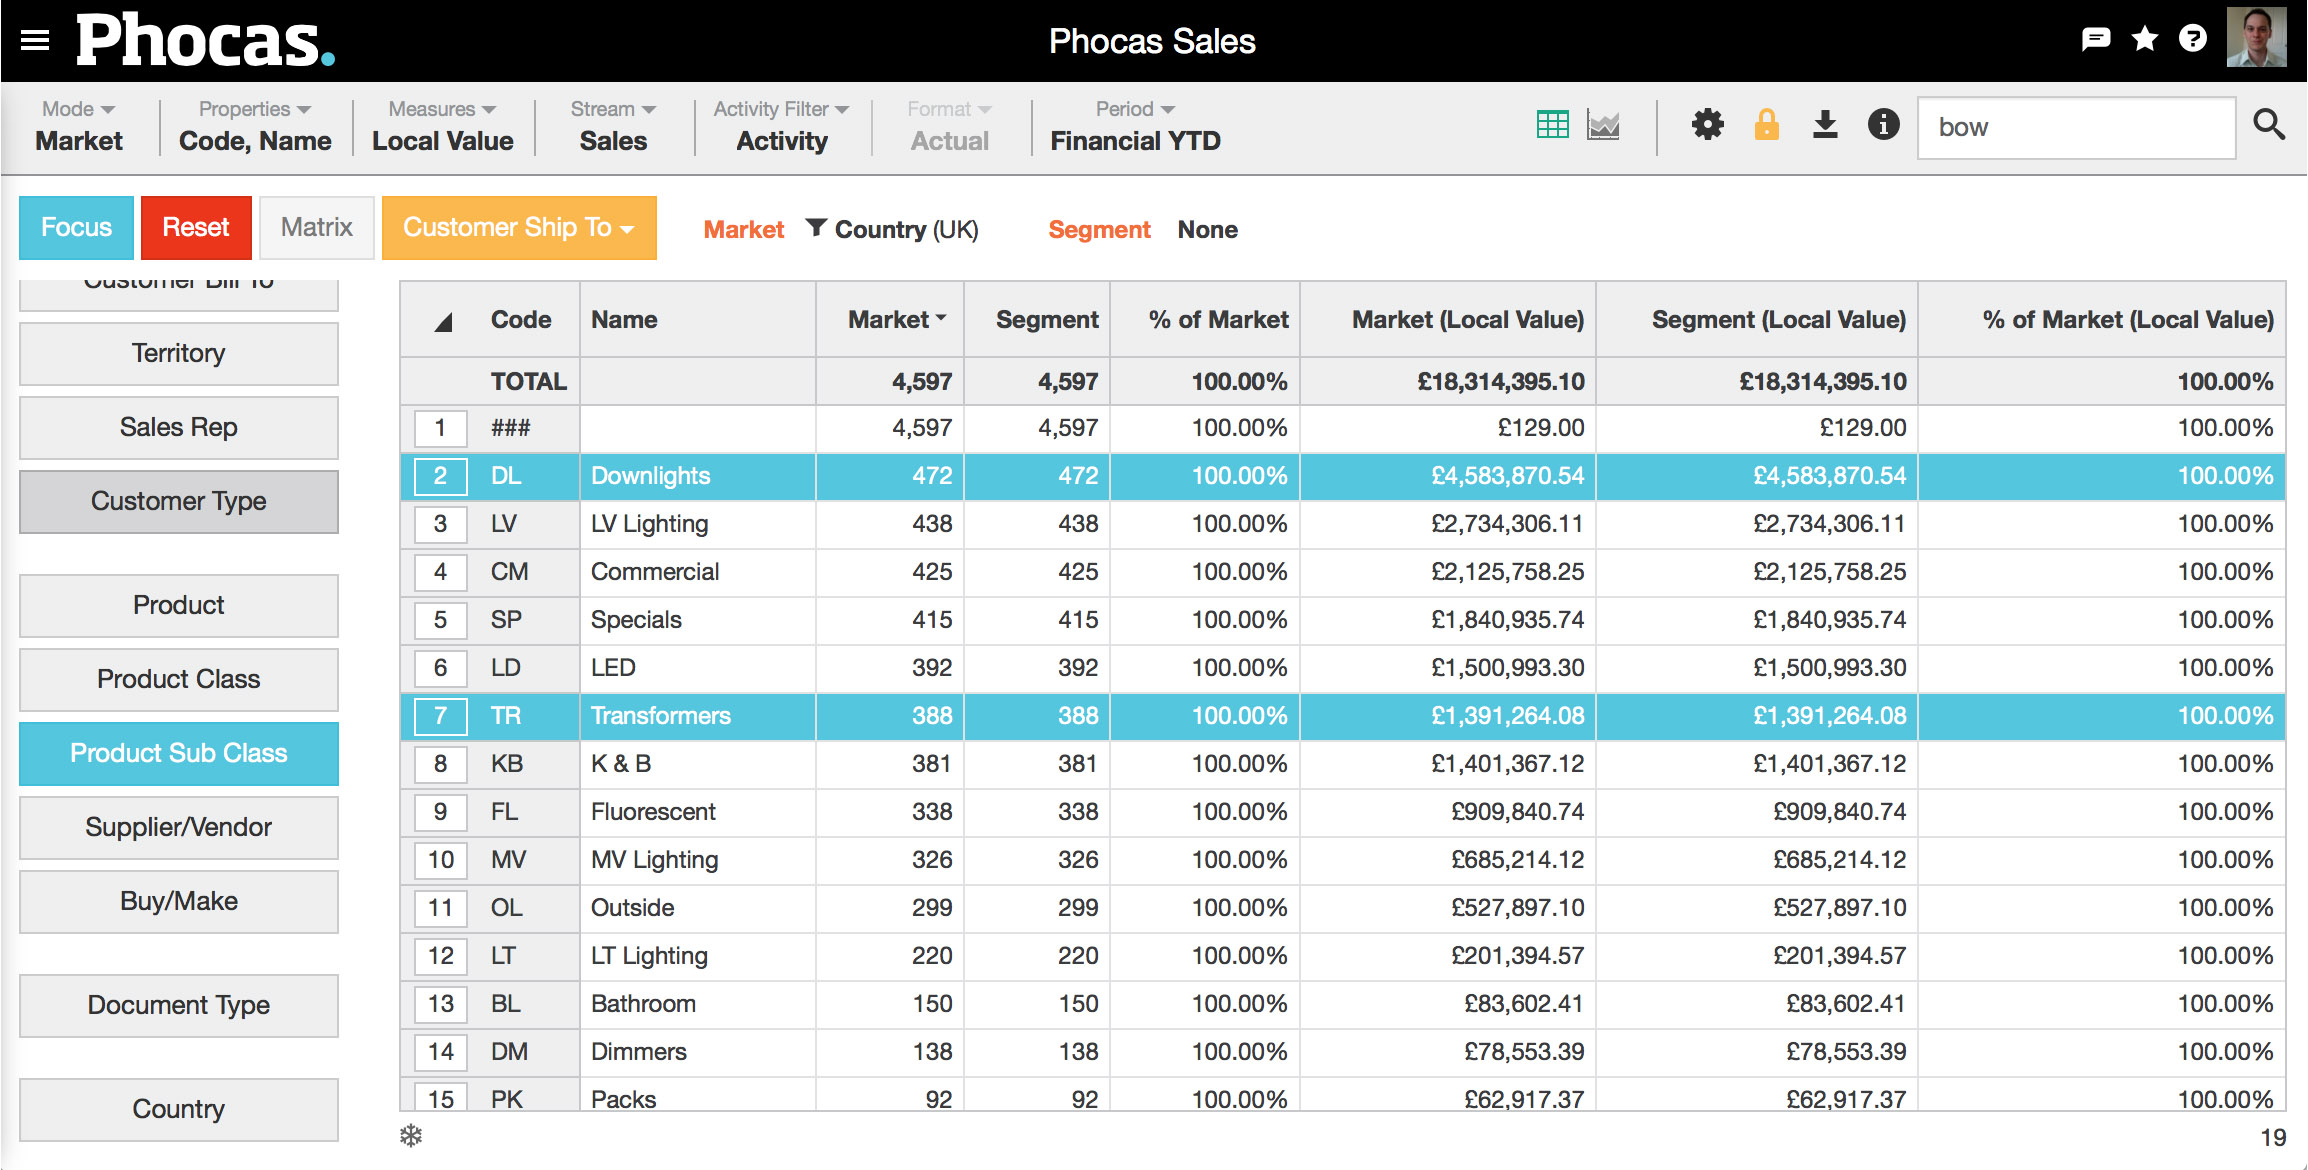
3. Choose your segment
Segment your selection. In this example, we've chosen downlights (DL) and transformers (TR) from our Product Sub Class dimension.
This is done in the usual slice and dice manner: select and focus. Two things will occur:
Any selections will appear next to the word 'segment' in the status bar.
The Segment column and the % of Market column will be populated with the relevant data.

4. Choose what to count
From the orange dropdown box, define your market by selecting what you'd like to count.
In this example we've selected Customer Ship To, so the number of customers will define our market. You could also count branches, or stores, or any of your dimensions.
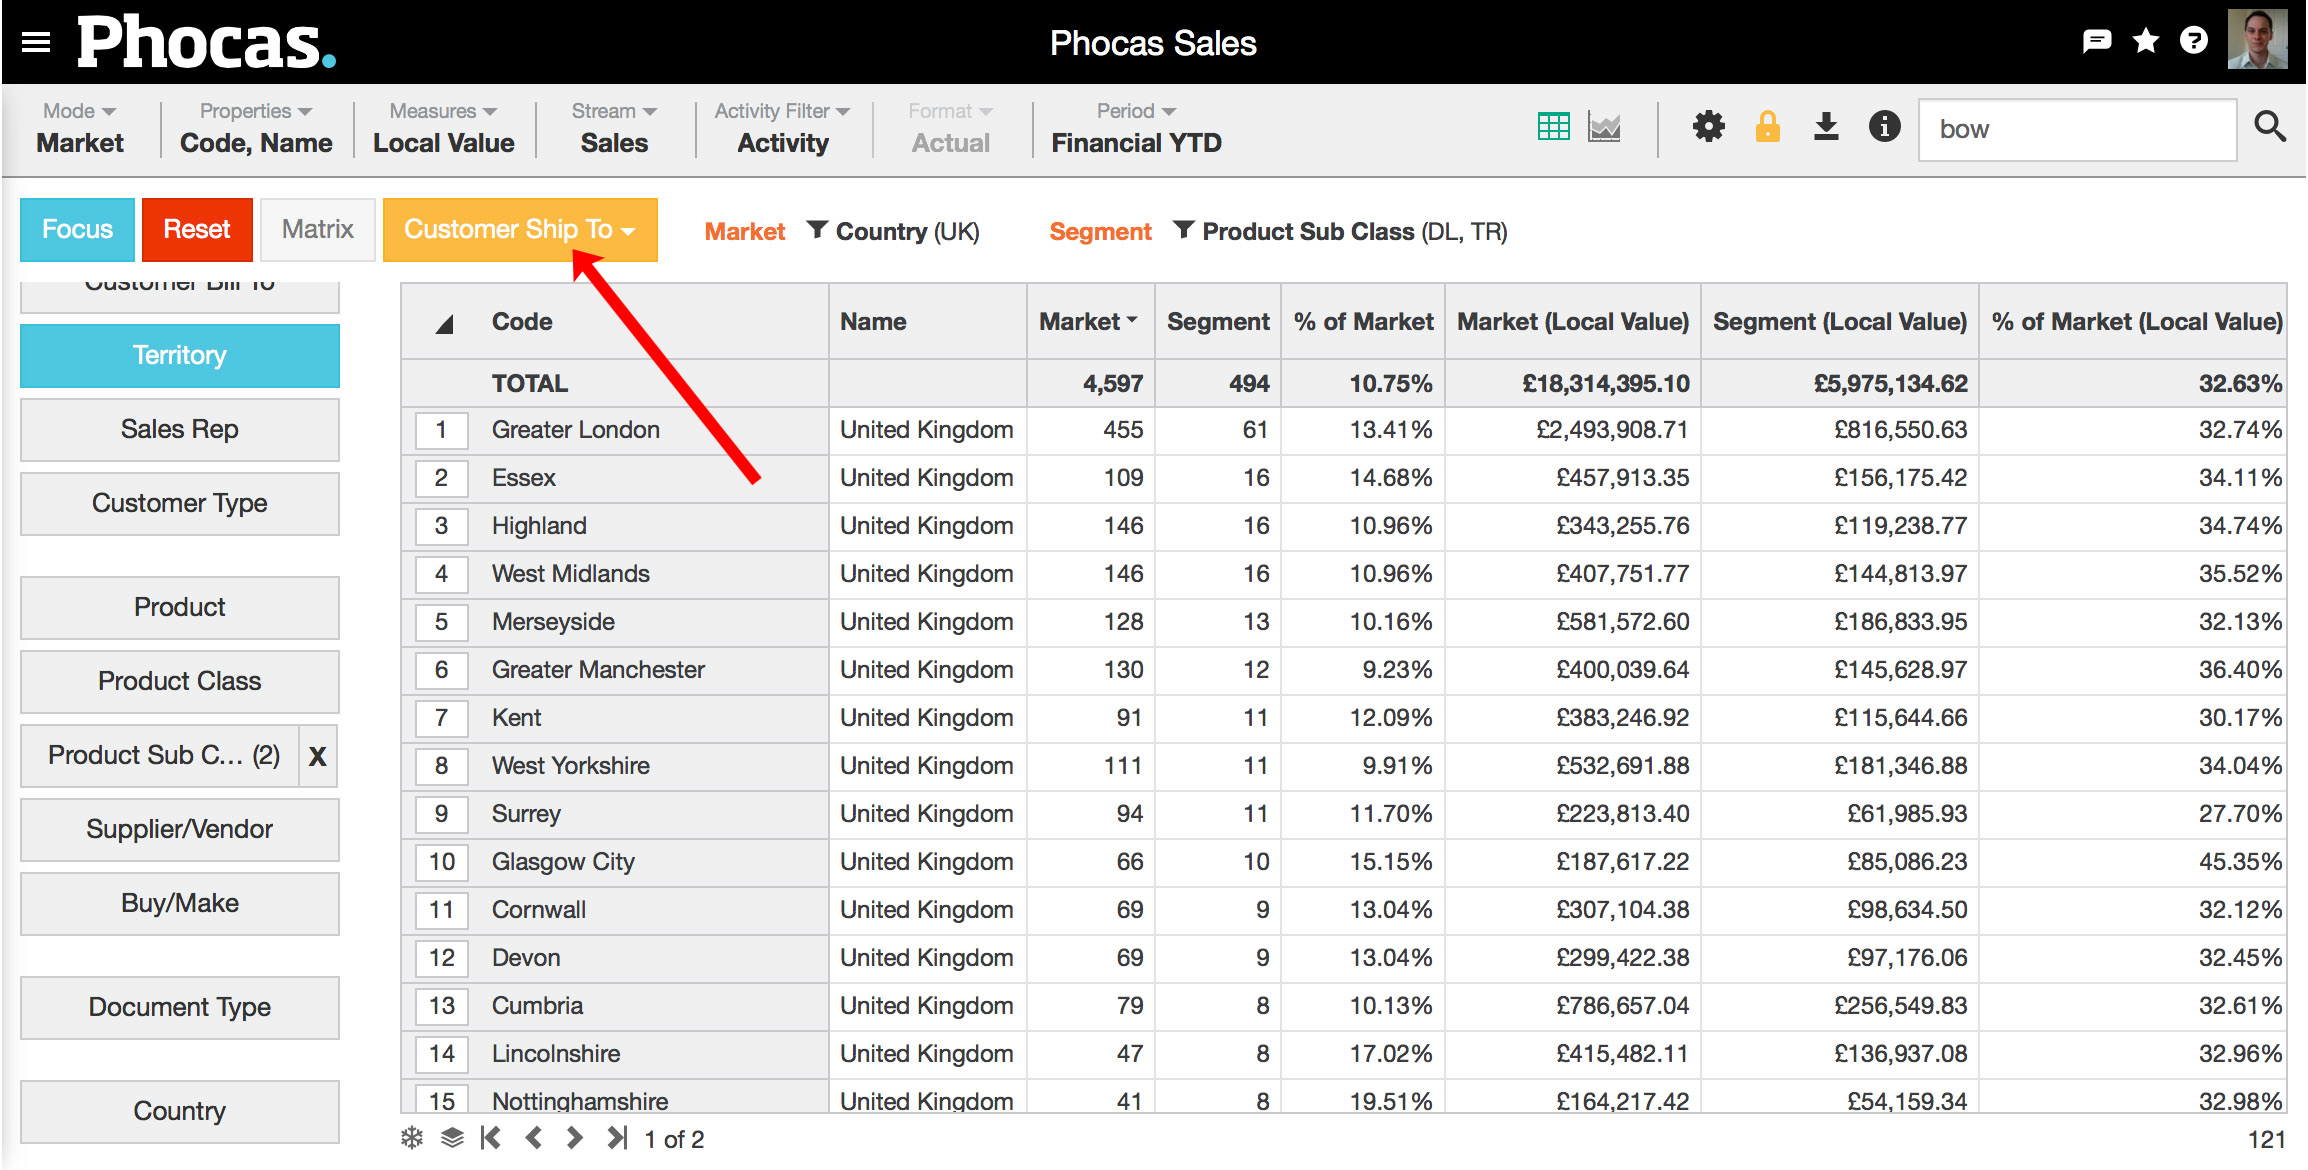
4. View and analyze
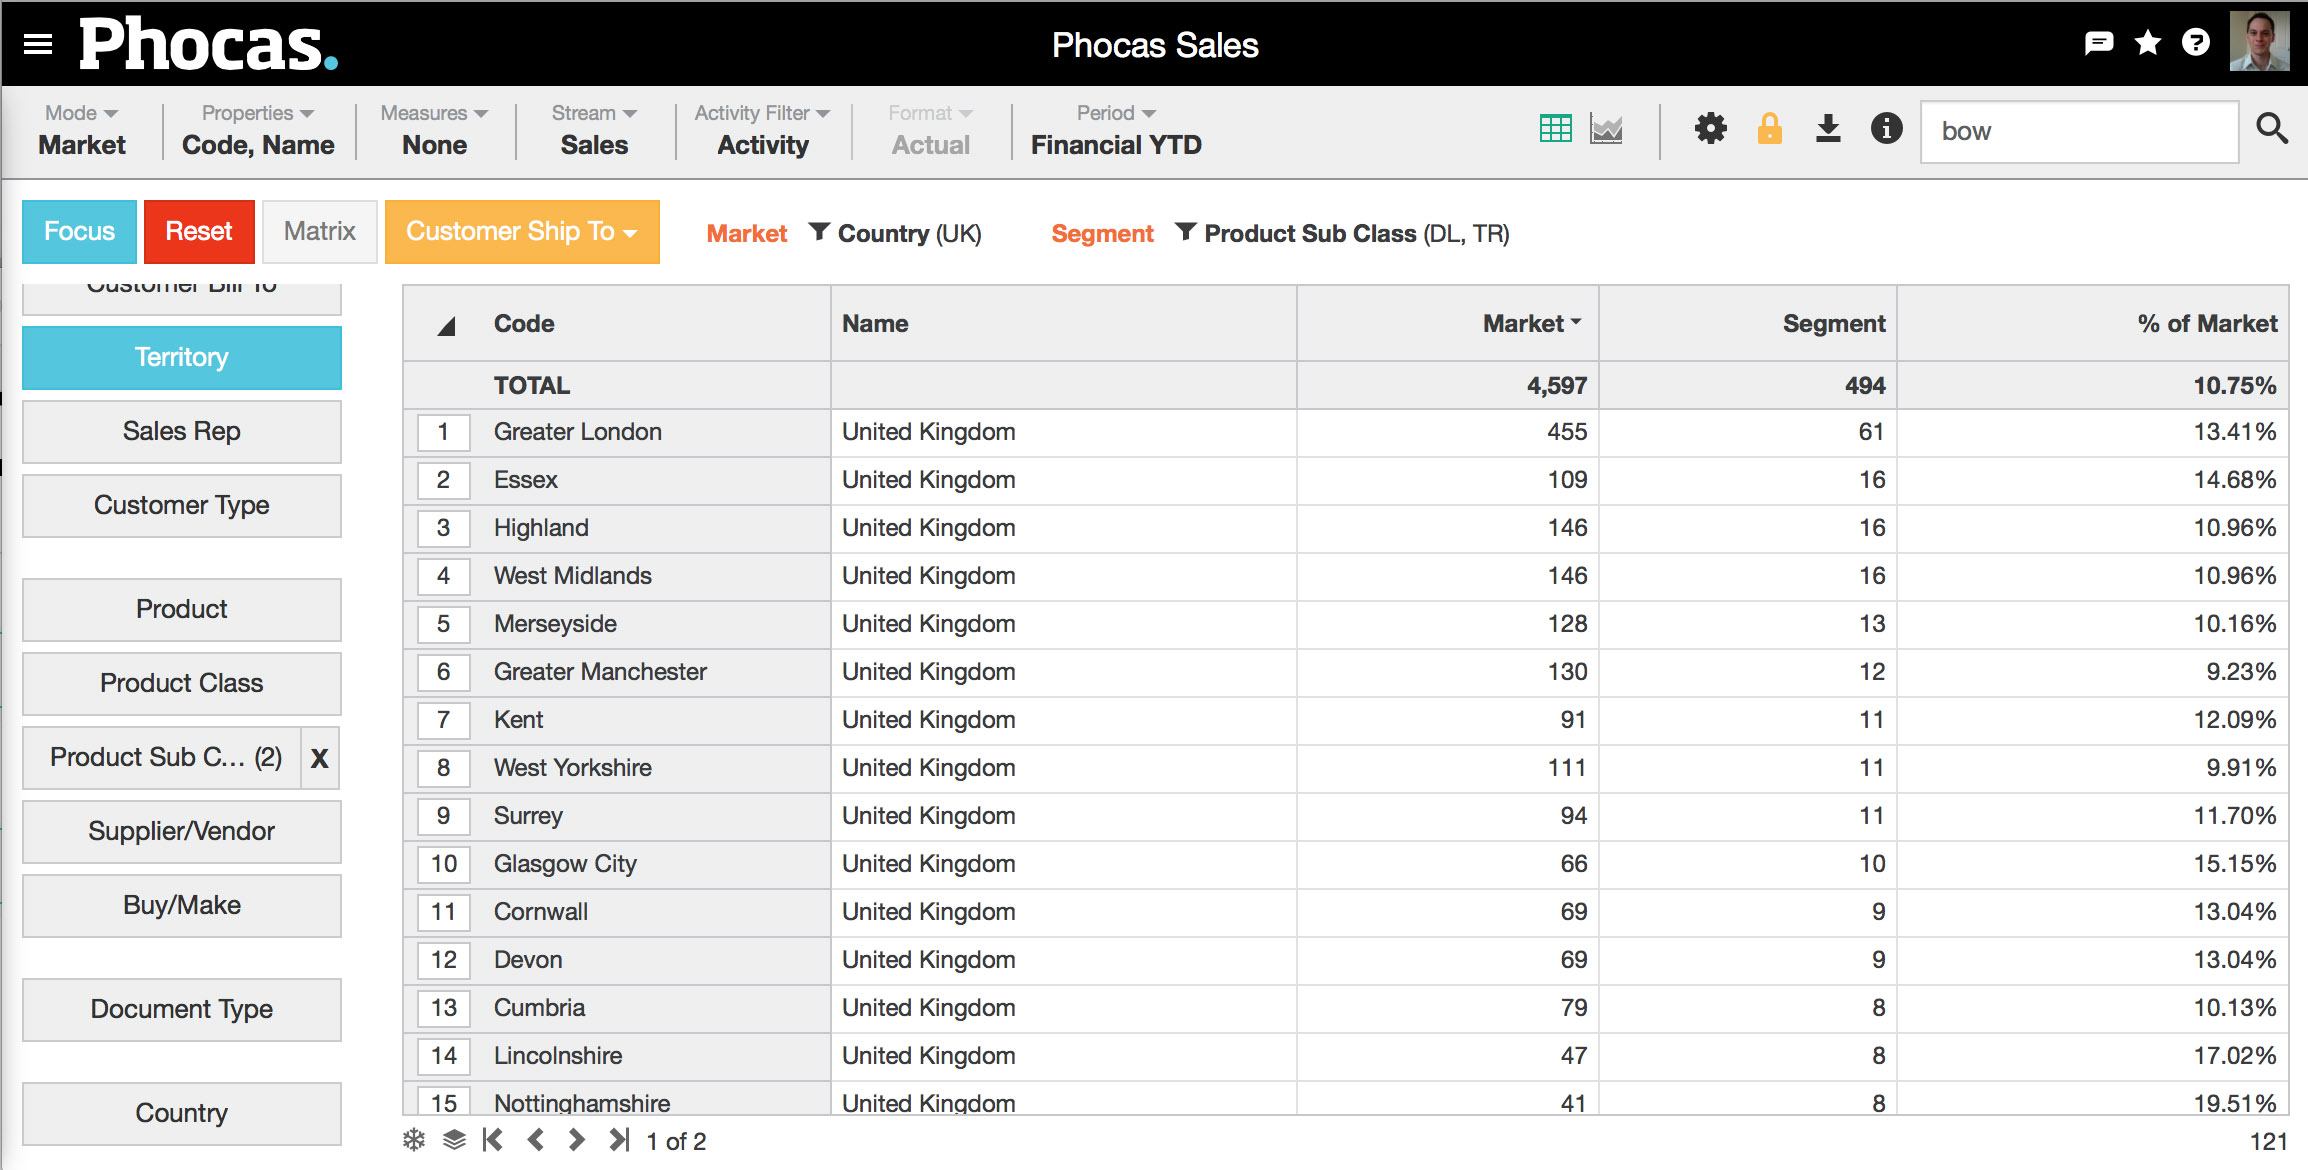
Click on the appropriate dimension for your analysis. In this example, we've chosen the territory dimension.
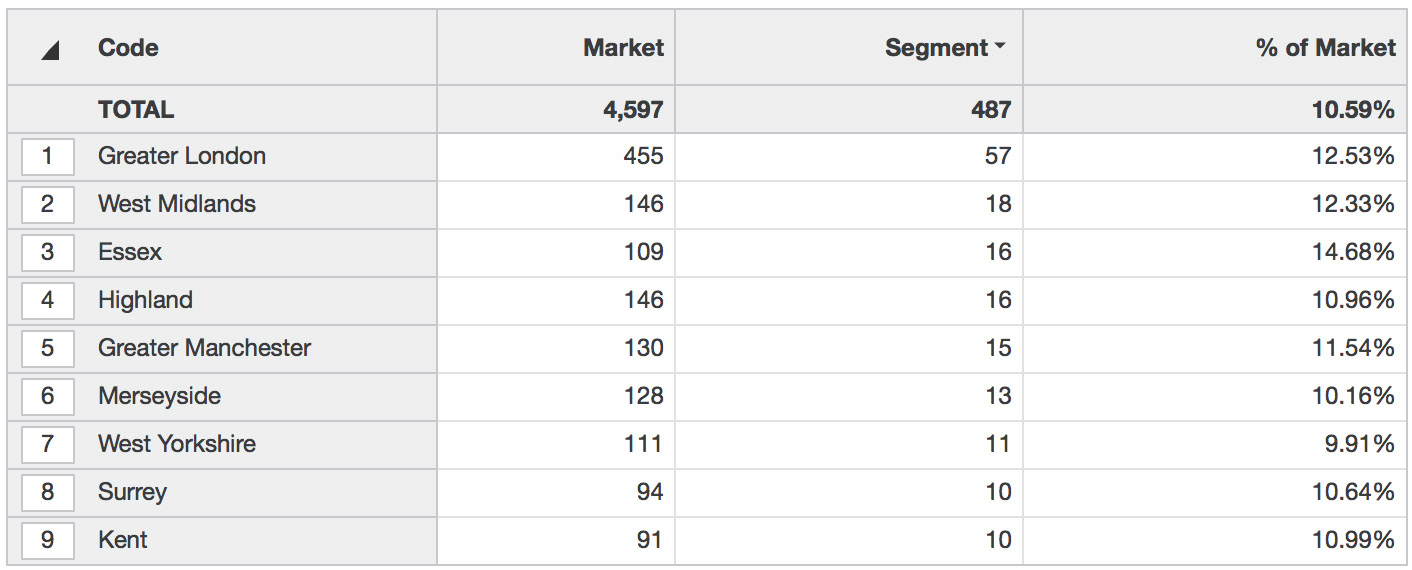
Choose the appropriate measures. In this example we've chosen None, which simplifies the grid by removing three columns.
Viewing these results shows, for example,
How it works
Process
Actions
What happens in the grid
Step 1
Make selections (and focus) in the usual way.
Anything focused on before entering market mode is the market. Results appear in the 'market' (first) column.
Step 2
Choose market from the mode button.
Step 3
Make more selections (and focus) in the usual way.
Anything focused on after entering market mode is a segment. Results appear in the 'segment' (second) column.
Step 4
Choose what you want to count (from the orange drop down box)
Additional market, segment and % of market columns appear for each measure selected.
Step 5
If required, also choose your measure(s). You can also choose no measures.
Step 6
Click on the dimension most relevant to your analysis.
View and analyse your results.
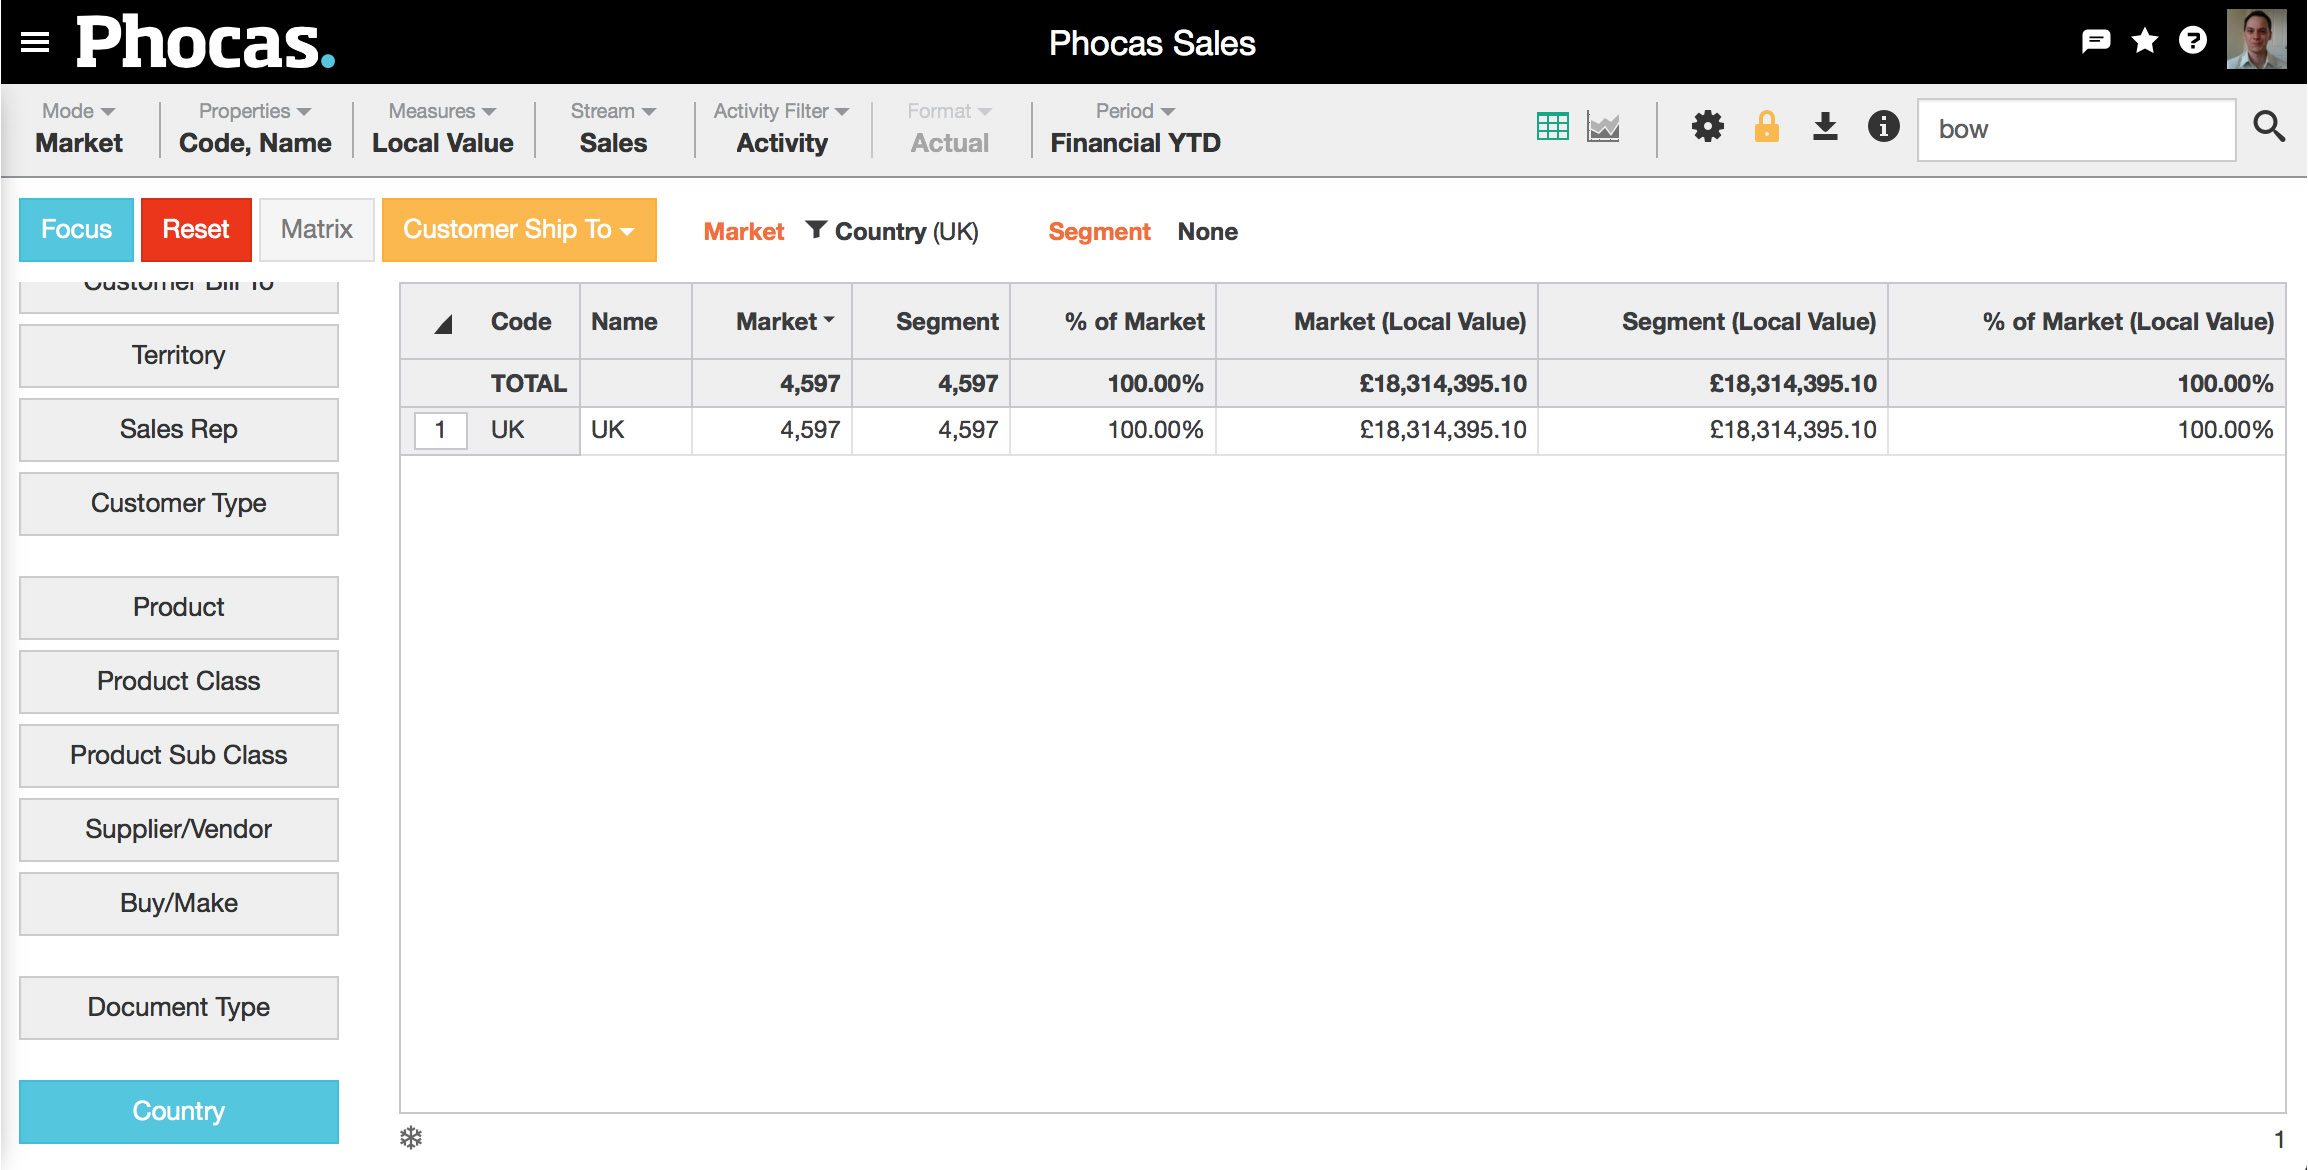
1. Choose your market
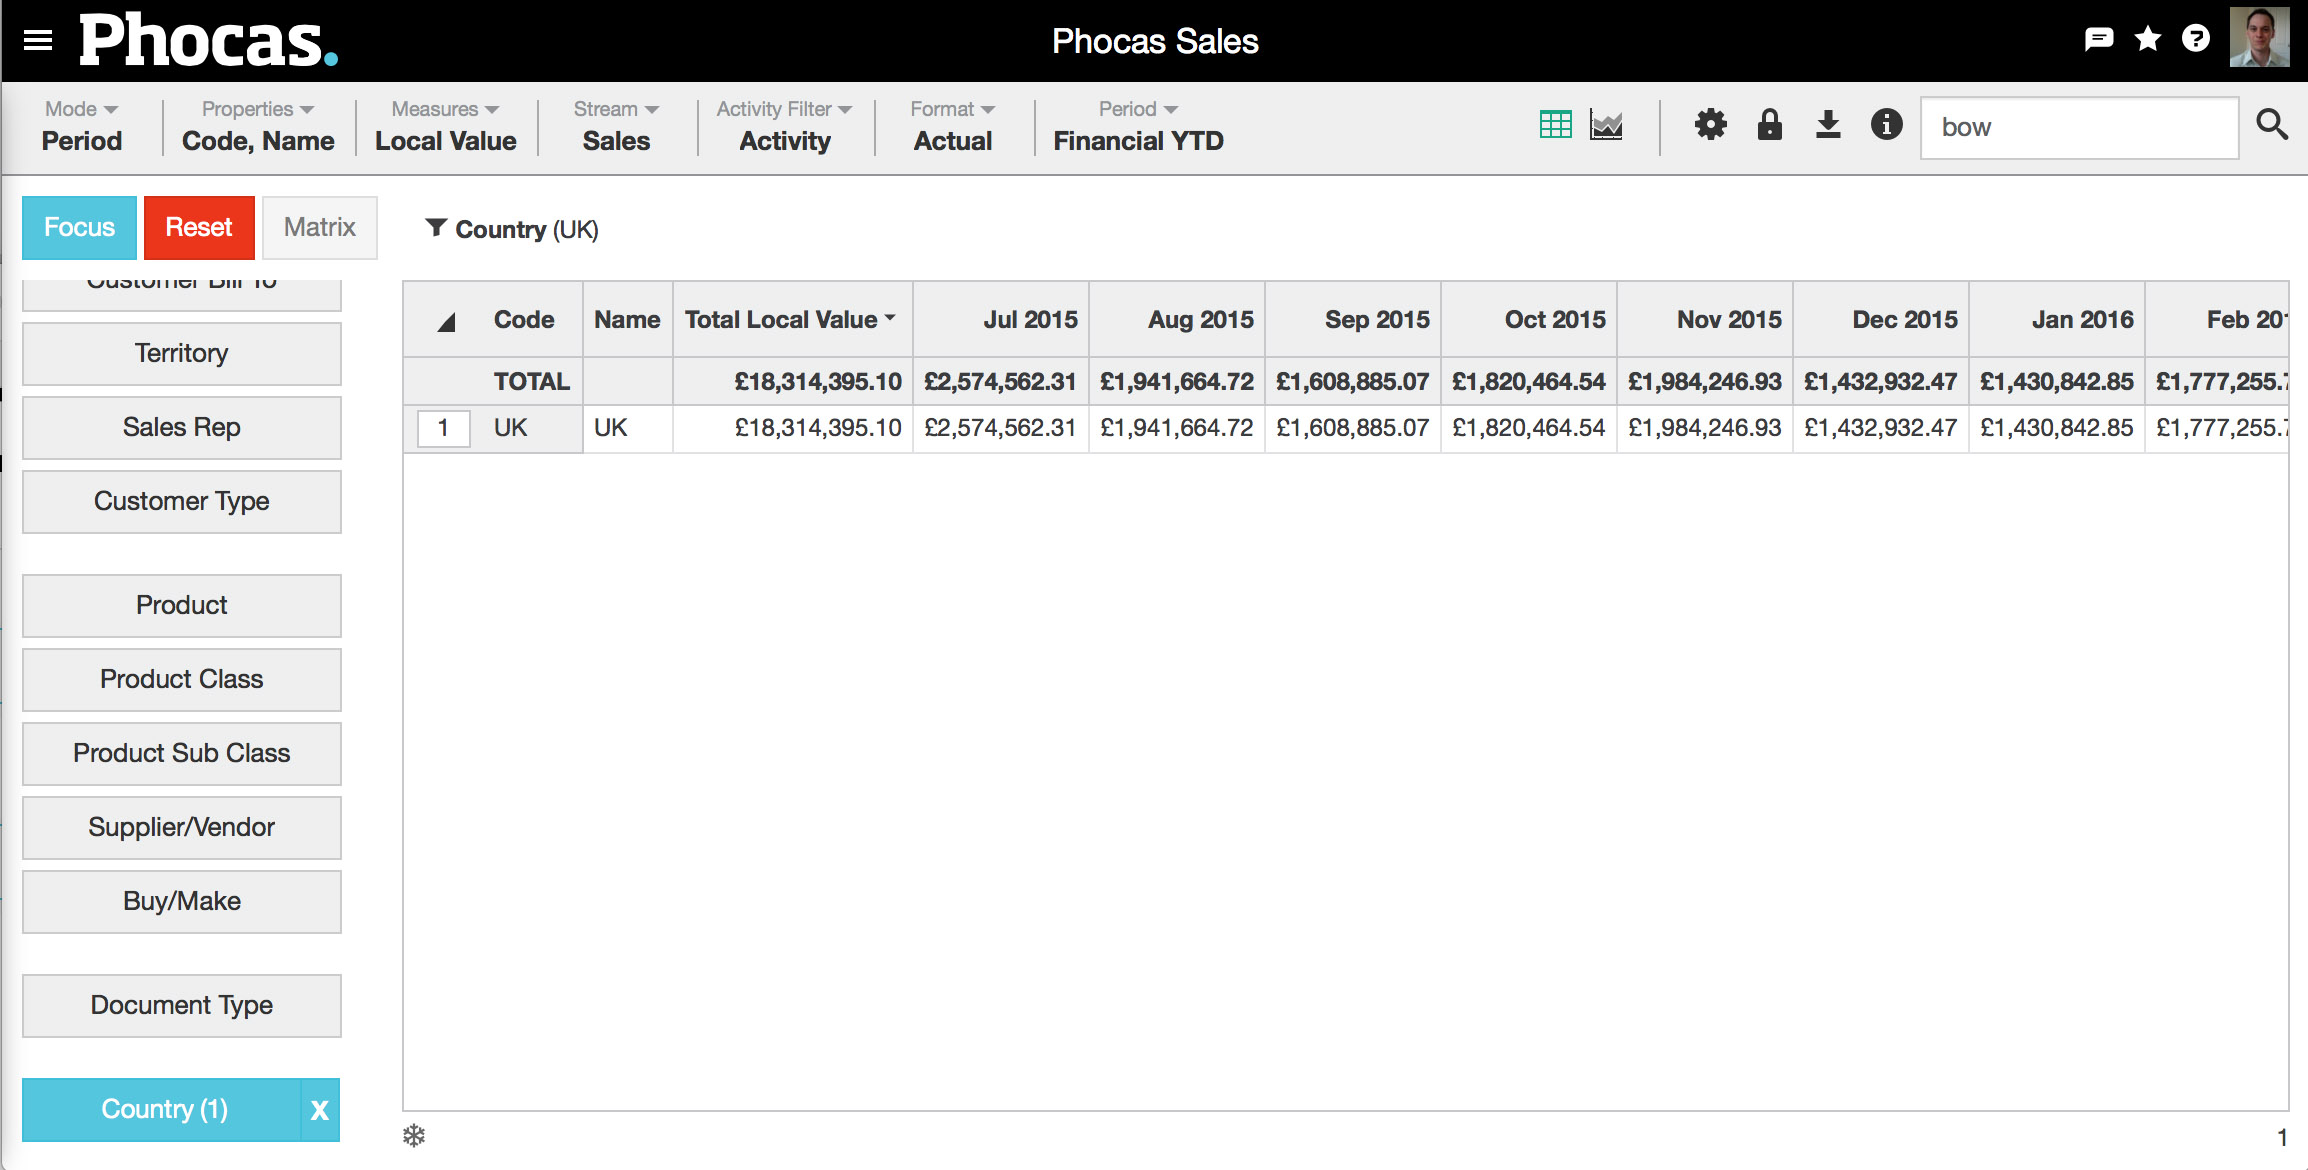
Do this by choosing a dimension and making selections as usual. In this example, we've chosen UK from the Country dimension, as shown.
* The market only includes selections that have activity in the period.
The following example shows the number of customers (market) who bought downlights and transformers products (segment).
Select the market: Click the Country dimension, select the UK country, then click the Focus button. The grid displays columns for the active properties (such as Code and Name) for that dimension, a Total column, and a column for each time unit in the current period.
Select the mode: Click Mode > Market. The selections you made above display next to the word Market in the status bar. They function in a similar way to the lock selections functionality (they no longer displays on the dimension button). The grid updates to display the following new columns for each measure: Market, Segment and % of Market.

Select the segment: Click the Product Sub Class dimension, select the DL Downlights and TR Transformers (TR) products, then click the Focus button. The selections you made display next to the word Segment in the status bar. The data updates in the Segment and the % of Market columns.
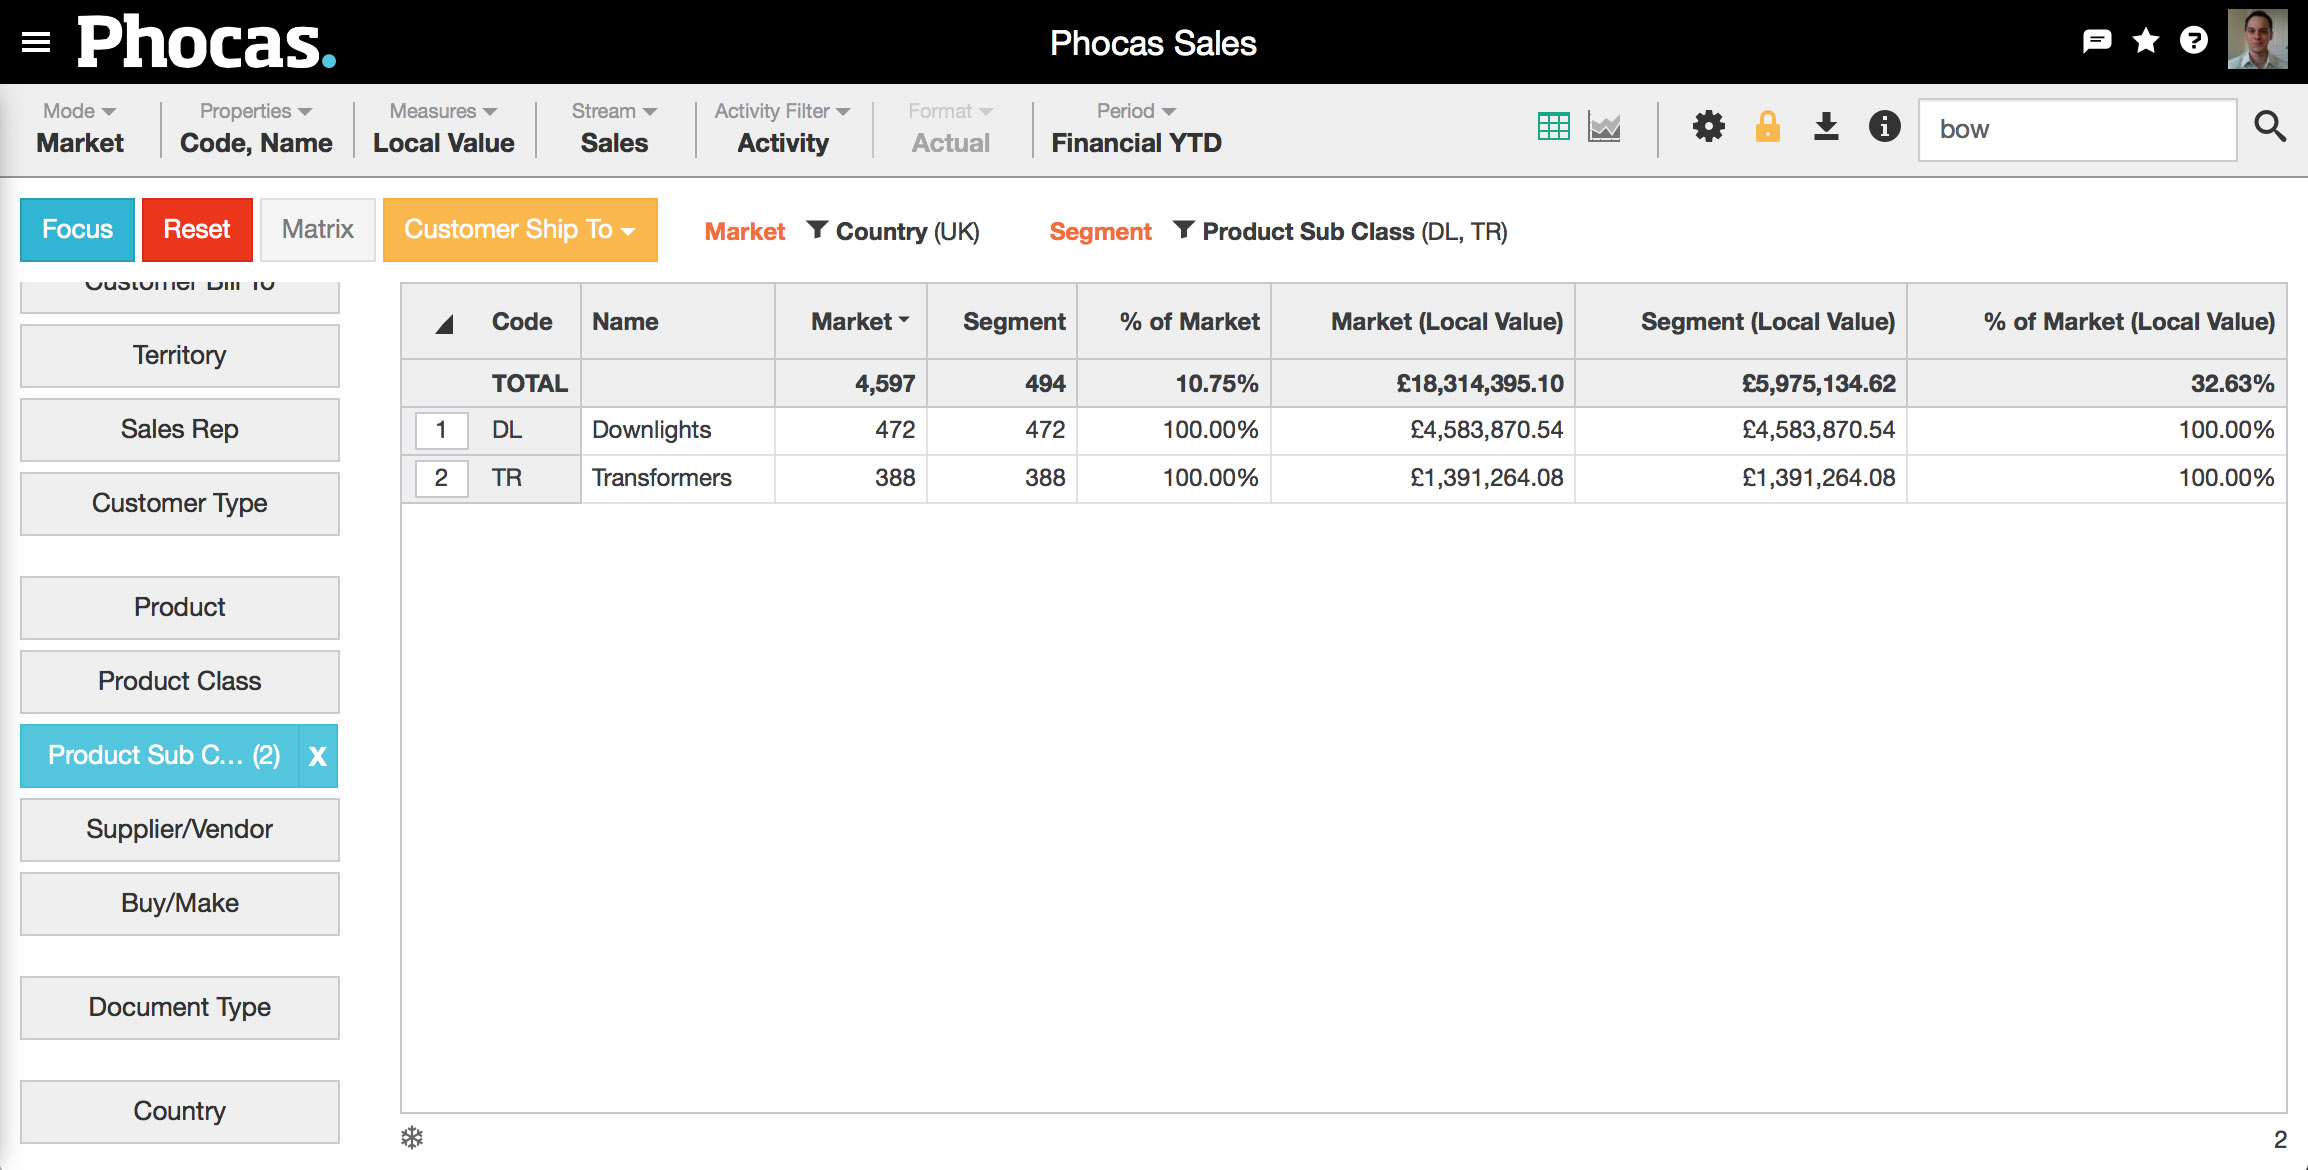
Define the market (select what you want to count): From the orange dropdown box, select the Customer Ship To dimension, so the number of customers defines the market.

Prepare the grid for analysis:
Click the Territory dimension.
Change the measures: Select None, to remove columns and simplify the grid.
Viewing and analyze the results. For example, you can see that of the 109 customers in Essex, only 16 are purchasing
Impact on performance

While still in market mode, you can make changes to your segment by clearing current selections and selecting/focusing on other data. The 'Segment' status bar will update accordingly. However, you can't change the market. To set a different market, you need to start again.
Notes:
The 'market' will only include selections that have activity in the period.
Market mode can't be charted.
Video
Overview video on the Phocas Academy.
https://www.phocassoftware.com/academy/videos/xv48ja26uu