During your analysis, you might ask yourself one of these questions, 'What’s behind this number? Where did this number come from? How did we get these results?'. Transaction mode can help you to answer such questions, as it takes the data currently displayed in the grid and replaces it with the relevant individual transactions*. It provides the most detailed data view of data, allowing you to see the base transactions, such as invoice lines.
| Info |
|---|
*You might not see all expected transactions in the grid because:
|
Typically, you would not use Transaction mode in Summary view. It is best to filter the data first , to narrow down your search, as you cannot select you can't select or focus on data when you are in Transaction mode. Also, as there is 's a limit * to the number of transactions that display displayed in the grid, you might not see all the transactions and, and therefore, not find the answers you are looking for.
See the example below or watch the video on the right to learn how to prepare your data for Transaction mode.
.
Open Transaction mode
After you have selected and focused on data, there are two ways of opening Transaction mode:
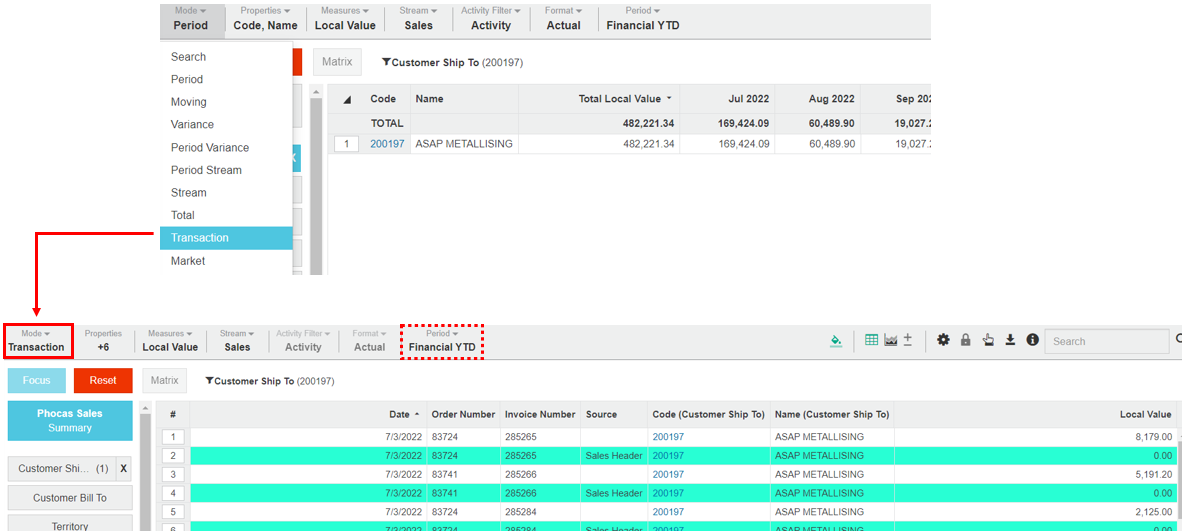
In the functions menu, click Mode > Transaction. This method retains your period selection and the grid displays the transactions* for that period.
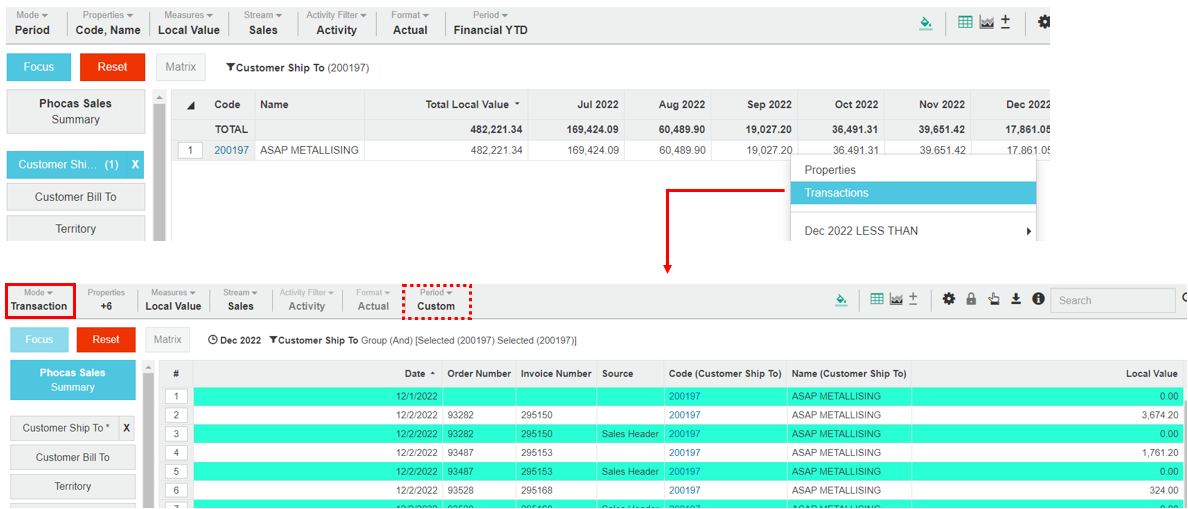
In the grid, right-click a value cell and select Transactions. This method changes your selected period into a custom period that corresponds to the transaction(s), and the grid display displays those transactions. This custom period persists , even after you leave Transaction mode or reset the grid. In effect, you apply another filter to the grid (for that specific time period).
View transactions
When you open Transaction mode, the transactions (see blue note above) display as rows in the grid. The number of transactions that depend on your organization's maximum limit*.
In Transaction mode, the Summary button is blue. This is because no dimensions are selected. You are looking at the raw, unfiltered data from our ERP system.
Initially, in Transaction mode, the grid displays columns for the active properties (such as Code and Name) for the selected dimension, plus a column for all active measures. You can customize this view of the transactions via the Properties menu, which behaves differently in Transaction mode (see below).
| Tip |
|---|
If an invoice number has a blue link, you can click that link to view the invoice for that transaction. |
Customize Transaction mode - change the properties
As mentioned above, the Properties menu behaves differently in Transaction mode. This is because in Transaction mode, no dimensions are selected, therefore, the Properties menu lists all the properties for all the dimensions. You have a lot of options to choose from.
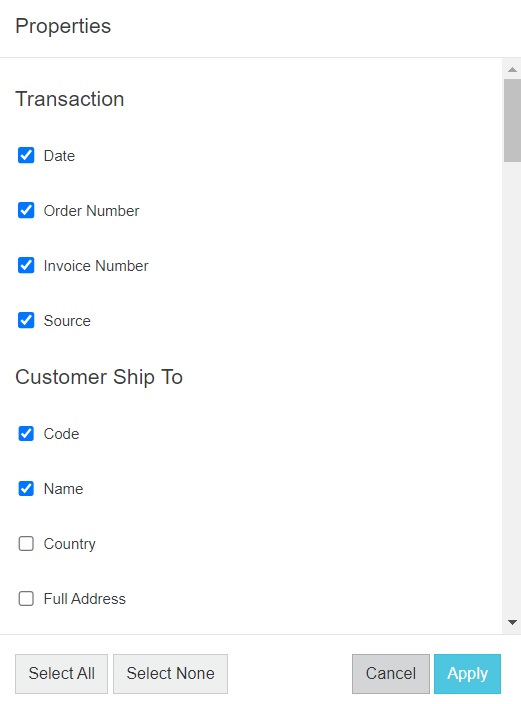
Click the Properties button. A window displays with the properties of all dimensions in the database , as well as and the transaction properties.
Select the items you want to display as columns in the grid and click Apply.
Search for transactions
In Transaction mode, you can search for individual transactions that meet certain conditions. For example, you might want to find a particular invoice , or instances where cost is greater than value, which you might use to look for 'giveaways' or other behavior affecting the sales value. You can find this information by performing an advanced search on properties and measures.
In Transaction mode, the Advanced Search window displays the stream's name of the stream above the dimensions. This is the only mode in which you will see this.

| Tip |
|---|
Save the search as a favorite or add it to a dashboard. Otherwise, if you close Transaction mode, the search is lost and you will need to must start again. |
Close Transaction mode
Click any dimension or select another mode to return to the default Period mode. You cannot click Reset to get out of exit Transaction mode.
Example - Use transaction mode
Use Transaction mode in the Sales database to view individual invoice lines within a customer account.
Prepare your data:
Click the Customer dimension.
Select a customer (100195) and click Focus.
Click Period > Previous Month.
Click Measures > Quantity and Local Value. The grid displays the following columns: Code, Name, Local Value and Quantity.
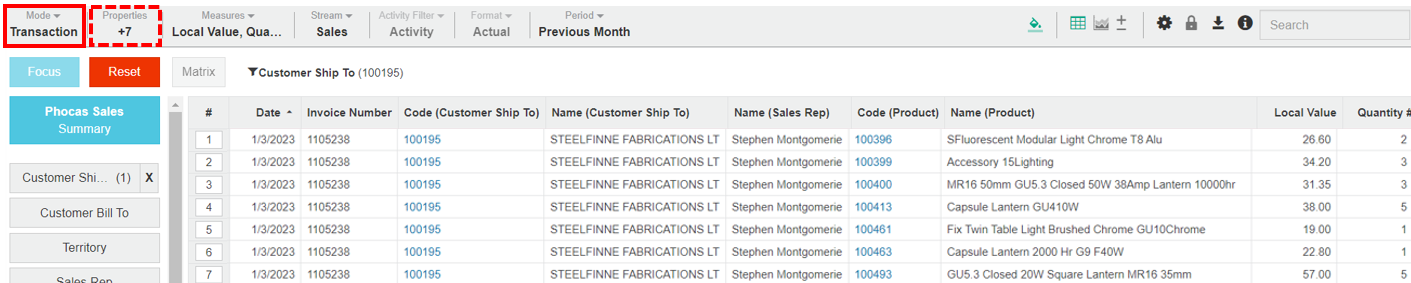
Select Mode > Transaction. The grid now displays the following columns: (Invoice) Date, Order Number, Invoice Number, Source, Code, Name, Local Value and Quantity.
Change the properties:
Click Properties.
Remove the Order Number and Source properties and keep the other selected properties. Then, then add the following properties: Product Code, Product Name, and Sales Rep Name.
Click Apply. The grid updates to display the new columns layout. You can see the value and quantity of the products purchased, as well as the invoice date and number and Sales Rep, as illustrated in the image in the View transaction section above.
On this page
| Table of Contents | ||||
|---|---|---|---|---|
|
Related pages
| Panel | ||
|---|---|---|
| ||
Video |